CONTACT US
When is the Closeness Centrality Algorithm best applied?

The Closeness Centrality algorithm is uniquely valuable in graph data science (GDS) and is commonly used to detect nodes that can spread information efficiently, measuring how central a node is to the group. In our Betweenness Centrality article, we briefly introduced centrality algorithms overall as some of the most commonly utilized algorithm types in GDS.
What is Closeness Centrality?
Closeness Centrality algorithms in general are unique because they are typically used to find nodes that can quickly interact with other nodes. A closeness centrality example where we care about how central a node is to the group is a disease spreading across the network which is represented in this context by nodes with high closeness centrality scores, which could represent potential superspreaders.
Here we will look at what is this algorithm and examine how it works conceptually and how can we account for edge cases, and then look at a use case to have a better grasp of the algorithm’s uses.
Mathematical Concepts
Closeness centrality indicates the degree of centrality, or how close a node is to all other nodes in the context of the network centrality. It is calculated as the average of the shortest path length from the node to every other node in the network.
While degree centrality measures how many neighbors a node has, the centrality score for this algorithm gives us an idea of the accessibility of one node with respect to all others. The node closest to all others, following the shortest path possible, has a higher accessibility and communication capacity to the other nodes. The logical next step is to look at how to calculate closeness centrality.
Undirected Network
In an undirected network, we estimate the shortest path to each node. In the graph network example shown in Figure 1, we can estimate the shortest path to each one of the 8 different nodes. For instance, the degree centrality of node A would be 1, while the shortest (geodesic) path from node A to node D would be 3 (D–C–B–A).
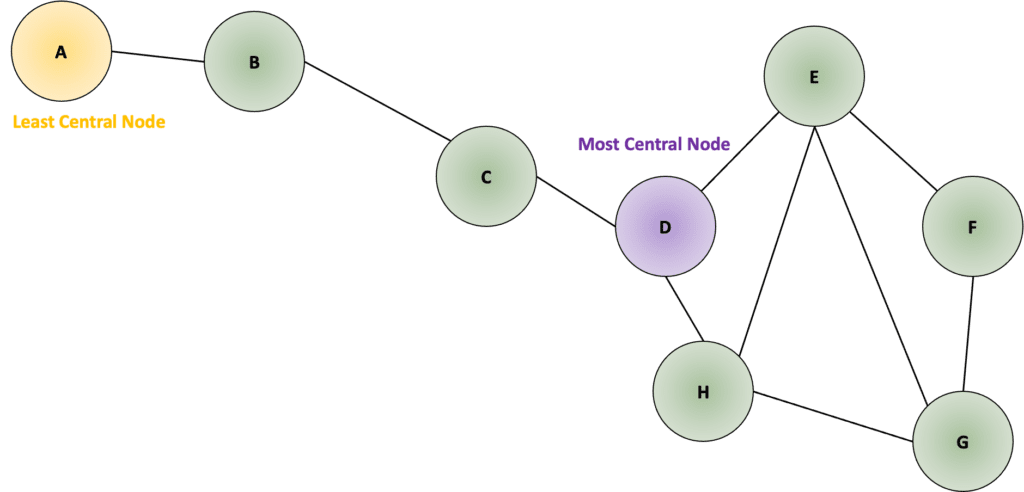
Building the geodesic distance matrix for all nodes in the graph network of Figure 1, Table 1 shows the shortest path from each one of the nodes to all others. It’s worth noting that the values on the left side of the diagonal match the ones on the right side, as the graph network is undirected.
| A | B | C | D | E | F | G | H | Normalized Score | |
|---|---|---|---|---|---|---|---|---|---|
| A | 0 | 1 | 2 | 3 | 4 | 5 | 5 | 4 | 0.29 |
| B | 1 | 0 | 1 | 2 | 3 | 4 | 4 | 3 | 0.39 |
| C | 2 | 1 | 0 | 1 | 2 | 3 | 3 | 2 | 0.50 |
| D | 3 | 2 | 1 | 0 | 1 | 2 | 2 | 1 | 0.58 |
| E | 4 | 3 | 2 | 1 | 0 | 1 | 1 | 1 | 0.54 |
| F | 5 | 4 | 3 | 2 | 1 | 0 | 1 | 2 | 0.39 |
| G | 5 | 4 | 3 | 2 | 1 | 1 | 0 | 1 | 0.41 |
| H | 4 | 3 | 2 | 1 | 1 | 2 | 1 | 0 | 0.50 |
The closeness centrality score for each one of the nodes in the network is estimated as the sum of the path of all other nodes divided by the number of nodes minus one. For example, for node D, the closeness centrality score would be 1÷(3+2+1+1+2+2+1) = 0.083; for node A, it would be 1÷(1+2+3+4+5+5+4) = 0.042. Comparing the score of both nodes, node D is more central than node A.
To account for the size of the network, we normalize the score by multiplying by the number of nodes minus one, assuming all nodes are connected to the network. The mathematical conceptual equation for the Closeness Centrality formula would be as shown in Equation 1. For example, for node D, the closeness centrality score would be 7÷(3+2+1+1+2+2+1) = 0.58.

Wasserman & Faust (1994) have proposed an improved formula for dealing with “n” unconnected nodes in a graph network. Alternatively, Beauchamp (1965) proposed to zero out all distances that were not accessible and therefore turned into infinity distances. This score is known as harmonic centrality (Neo4j offers a good article on this here).
Directed Network
In the case of directed networks, most software only calculates the outbound closeness centrality, considering the outbound relationships: the most important node is the one that can reach all other nodes in the network most quickly and helps define good broadcasters (e.g., Instagram), which is important in diffusion processes.
The inbound closeness centrality accounts for the inbound relationships and it can be useful if we want to find the optimal location for a customer or improve the search results of a website; in these cases, the incoming parts are meaningful.
Website searches represent another good closeness centrality example to better grasp the difference between the outbound and inbound closeness centrality score: we can have a high closeness centrality from outgoing website links, but low closeness centrality from incoming website links.
Weighted Network
We can also calculate closeness centrality in weighted networks, where the distances are not always going to be the same. In this case, the shortest path is not the one with the least hops but the one with the minimum total weighted distance. For instance, in the example shown in Figure 2, accounting for weighted paths, the shortest distance between nodes D and G includes two hopes (D-F-G=2), instead of the single hop option (D-G=5).
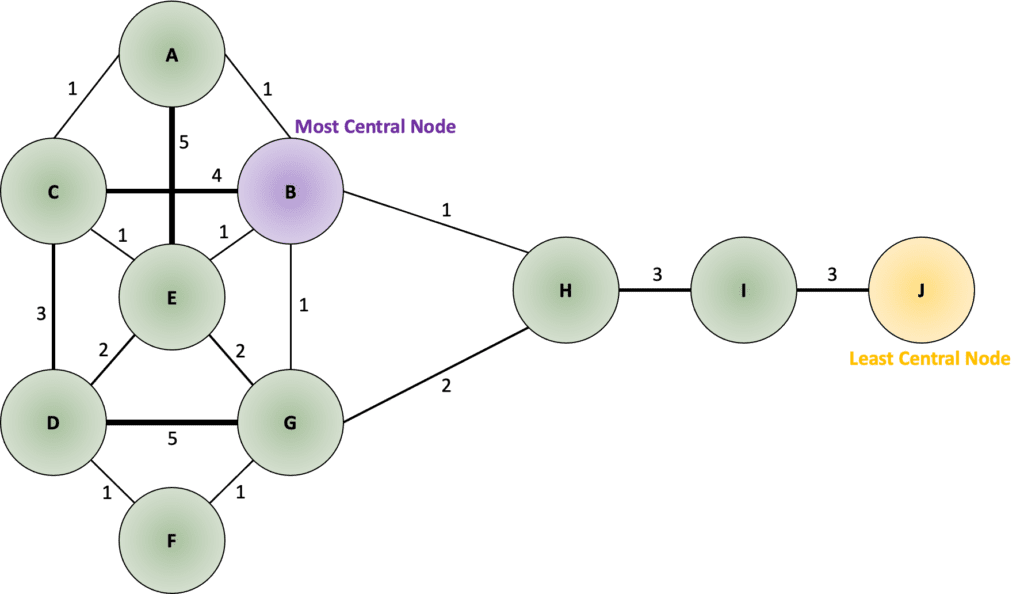
As the geodesic matrix in Table 2 shows, in this example, the normalized closeness centrality score for node B is 9÷(1+2+3+1+2+1+1+4+7) = 0.41, which turns out to be the most central node in this network, and for node J, it is 9÷(8+7+9+10+10+9+8+6+3) = 0.13, resulting to be the farthest node.
| A | B | C | D | E | F | G | H | I | J | Normalized Score | |
|---|---|---|---|---|---|---|---|---|---|---|---|
| A | 0 | 1 | 1 | 4 | 2 | 3 | 2 | 2 | 5 | 8 | 0.32 |
| B | 1 | 0 | 2 | 3 | 1 | 2 | 1 | 1 | 4 | 7 | 0.41 |
| C | 1 | 2 | 0 | 3 | 1 | 4 | 3 | 3 | 6 | 9 | 0.28 |
| D | 4 | 3 | 3 | 0 | 2 | 1 | 2 | 4 | 7 | 10 | 0.25 |
| E | 2 | 1 | 1 | 2 | 0 | 3 | 2 | 2 | 5 | 8 | 0.35 |
| F | 3 | 2 | 4 | 1 | 3 | 0 | 1 | 3 | 6 | 9 | 0.28 |
| G | 2 | 1 | 3 | 2 | 2 | 1 | 0 | 2 | 5 | 8 | 0.35 |
| H | 2 | 1 | 3 | 4 | 2 | 3 | 2 | 0 | 3 | 6 | 0.35 |
| I | 5 | 4 | 6 | 7 | 5 | 6 | 5 | 3 | 0 | 3 | 0.2 |
| J | 8 | 7 | 9 | 10 | 8 | 9 | 8 | 6 | 3 | 0 | 0.13 |
When do we use a Closeness Centrality Algorithm?
The closeness centrality algorithm can be used in a number of various use cases, it is often used in social networks to know how fast the data propagates through short routes (e.g. Kiss & Bichler, 2008) or to estimate the arrival of the information transmitted within a telecommunication channel.
The algorithm’s score can also be applied to estimate an optimal postal route based on the shortest paths for parcel delivery services.
When selecting closeness centrality amongst the different centrality algorithms, we should keep in mind that:
- The position of the node is related to the entire network (big advantage!).
- Closeness Centrality is sensitive to changes in the network.
- All nodes must be reachable as a constraint to estimate the closeness centrality score.
Conclusions
So what is closeness centrality? As mentioned in the introduction, a Closeness Centrality algorithm is used to detect which nodes are more efficient at spreading information through the network by measuring how central a node is to the network as whole.
Depending on the nature of the network (undirected vs. directed vs. weighted), we should estimate the normalized closeness score to determine which node is the most central to the network. From this we are able to find the optimal node which allows data to propagate through the shortest paths in the network.
These and other graph algorithms make up the tools by which modern machine learning is advancing, via graphs and graph data science.
Read Related Articles
- What is Graph Data Science?
- What is Neo4j Graph Data Science?
- What are Graph Algorithms?
- Graph Traversal Algorithms (a.k.a Pathfinding algorithms)
- Pathfinding Algorithms (Top 5, with examples)
- Degree Centrality
- Betweenness Centrality
- PageRank
- Conductance Graph Community Detection: Python Examples
- Graph Embeddings (for more on graph embedding algorithms)
Also read this related article on graph analytics for more on analytics within the graph database context.
Graphable helps you make sense of your data by delivering expert data analytics consulting, data engineering, custom dev and applied data science services.
We are known for operating ethically, communicating well, and delivering on-time. With hundreds of successful projects across most industries, we have deep expertise in Financial Services, Life Sciences, Security/Intelligence, Transportation/Logistics, HighTech, and many others.
Thriving in the most challenging data integration and data science contexts, Graphable drives your analytics, data engineering, custom dev and applied data science success. Contact us to learn more about how we can help, or book a demo today.
Still learning? Check out a few of our introductory articles to learn more:
- What is a Graph Database?
- What is Neo4j (Graph Database)?
- What Is Domo (Analytics)?
- What is Hume (GraphAware)?
Additional discovery:
- Hume consulting / Hume (GraphAware) Platform
- Neo4j consulting / Graph database
- Domo consulting / Analytics - BI
We would also be happy to learn more about your current project and share how we might be able to help. Schedule a consultation with us today. We can also discuss pricing on these initial calls, including Neo4j pricing and Domo pricing. We look forward to speaking with you!
Graphable helps you make sense of your data by delivering expert analytics, data engineering, custom dev and applied data science services.
We are known for operating ethically, communicating well, and delivering on-time. With hundreds of successful projects across most industries, we have deep expertise in Financial Services, Life Sciences, Security/Intelligence, Transportation/Logistics, HighTech, and many others.
Thriving in the most challenging data integration and data science contexts, Graphable drives your analytics, data engineering, custom dev and applied data science success. Contact us to learn more about how we can help, or book a demo today.
We are known for operating ethically, communicating well, and delivering on-time. With hundreds of successful projects across most industries, we thrive in the most challenging data integration and data science contexts, driving analytics success.
Contact us for more information: