CONTACT US
Conductance for Graph Community Detection: Leveraging Python for Improved Community Assessments
Community detection is a pivotal aspect of network analysis, providing valuable insights into the structural organization of complex systems. One useful metric in this realm is conductance for graph community detection, a measure of community cohesion. In this article, we delve into the nuanced world of conductance for graph community detection, exploring its significance and unveiling expert strategies to optimize this process.
Understanding Conductance for Graph Community Detection
Conductance, within the context of graph community detection, serves as a pragmatic measure of community quality. It gauges the tightness of a community by assessing the ratio of internal edges to the total edges connected to the nodes within that community. A lower conductance value indicates a more tightly-knit, well-defined community, while a high conductance indicates a community which is has more connections outside of its own members, offering valuable insights into the structural integrity of a network and its respective communities.
The Value of the Conductance Metric
The importance of conductance metric for graph community detection can be seen throughout network analysis. It serves as a means to guide analysts and researchers towards communities that carry genuine meaning within the complex web of connections. Networks characterized by low conductance communities tend to exhibit distinct groupings, enhancing interpretability and facilitating informed decision-making. Utilizing conductance ensures that identified communities faithfully mirror the underlying network structure.
Conductance Graph Community Detection Python Example
Now let’s look at how to take advantage of a specific code approach, with conductance graph community detection python examples. To do this we’ll look through an example of a real world dataset, find the communities within it, find their respective conductance scores, then see what insights we can derive from this measurement.
The Graph
For this example, we’ll use the Les Miserables graph from NetworkX which contains a network of characters in the novel Les Miserables based on their coappearance within scenes. This graph is particularly useful for our purpose, for as we’ll see, its communities exhibit varying levels of connectedness.
import networkx as nx
# Load graph
G = nx.les_miserables_graph()
Interestingly, a followup from the original author of the data he reveals that the data actually contains an error by omitting a connection between a character and her daughter.
In particular, I recently learned that I forgot to include any connection between Fantine and her infant daughter Cosette, when I summarized the encounters between the characters of Les Misérables in the data file jean.dat. Fantine and Cosette appear together in chapter 1.4.1 (and then, of course — alas — they never see each other again)
Donald E. Knuth, https://www-cs-faculty.stanford.edu/~knuth/sgb.html
This led to the obvious question of whether or not NetworkX’s implementation of the dataset accounts for this. A question which could not go unanswered.
# Check for familial separation
'Cosette' in G['Fantine']
>>> False
With that mystery solved and for the sake of completeness, we’ll remedy this exclusion.
# Reunite Fantine and Cosette
G.add_edge('Fantine', 'Cosette')
With our network justice done, we can take a look at our network structure:
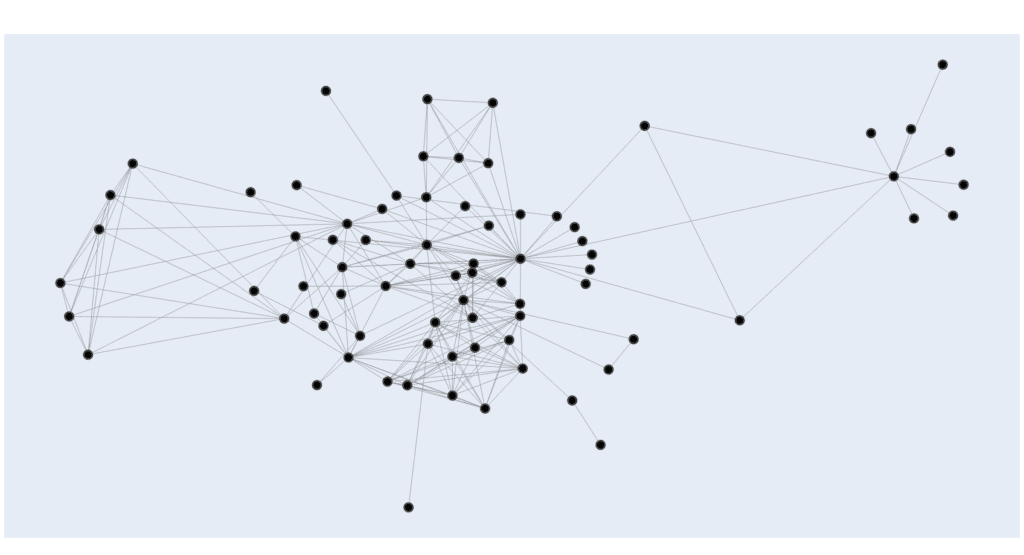
Here we can see a graph comprised of a variety of patterns which can be thought of as approximate communities based on a glance. We can see highly intermingled clusters in the center with some outlying groups of nodes forming more independent groups. Now let’s take a look to see if we can identify these visually obvious groups algorithmically.
The communities
Next we’ll use the Louvain algorithm for this example. As mentioned in our blog on graph algorithms, Louvain is classic community detection algorithm which is both efficient and effective. In this case, we’ll use CDlib’s implementation of Louvain as they provide great helper functions for all things community detection.
from cdlib.algorithms import louvain

# Run Louvain community detection
communities = algorithms.louvain(G)
After running Louvain, we get the following community structure:
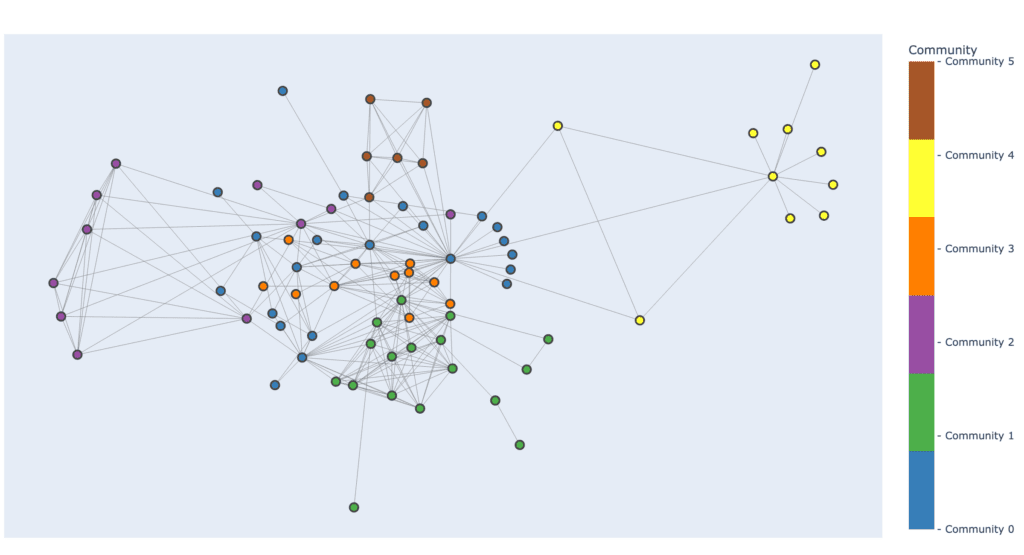
Now we can see the communities which were previously visually obvious defined far more explicitly. As before, we can see the same patters, but are able to ascribe specific names the the groups.
For example, communities 0 and 3 appear highly connected amongst the rest of the network, while communities 2 and 4 appear quite removed. However, like before in the groups themselves, it is not sufficient to qualitatively describe thier connectedness with the rest of the network. For that we must measure their conductance.
Their Conductances
To find the conductance for graph community detection, we’ll take advantage of the tools provided by CDlib.
from cdlib import evaluation

# Calculate conductance of each community
conductances = evaluation.conductance(G, communities, summary=False)
This will calculate the conductance for Graph Community Detection of each community and return them as a list. Running it on the Les Miserables graph returns the following:
>>> [0.38461538461538464,
     0.14285714285714285,
     0.14666666666666667,
     0.3111111111111111,
     0.13043478260869565,
     0.21052631578947367]
This is a great start towards understanding our network. Next let’s add some context to these values through some visualization.
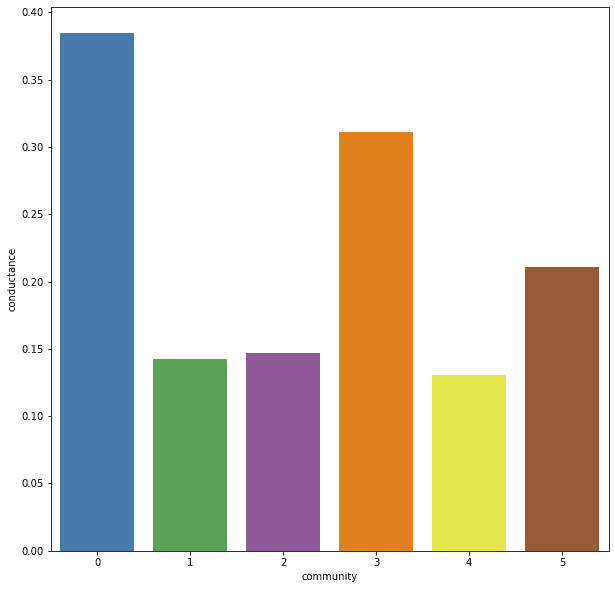
Now we can explicitly quantify our previous observations. As suspected, we see that communities 0 and 3 have the highest conductance values due to their high levels of connections across the network, while communities 1, 2, and 4 have some of the lowest levels. It is particularly interesting to note that community 1 is amongst the lowest conductance communities, despite it appearing quite connected visually. This only further reinforces the need to not simply rely on visual intuition but to quantify observations wherever possible. Lets view the data from another perspective to expand on this idea.
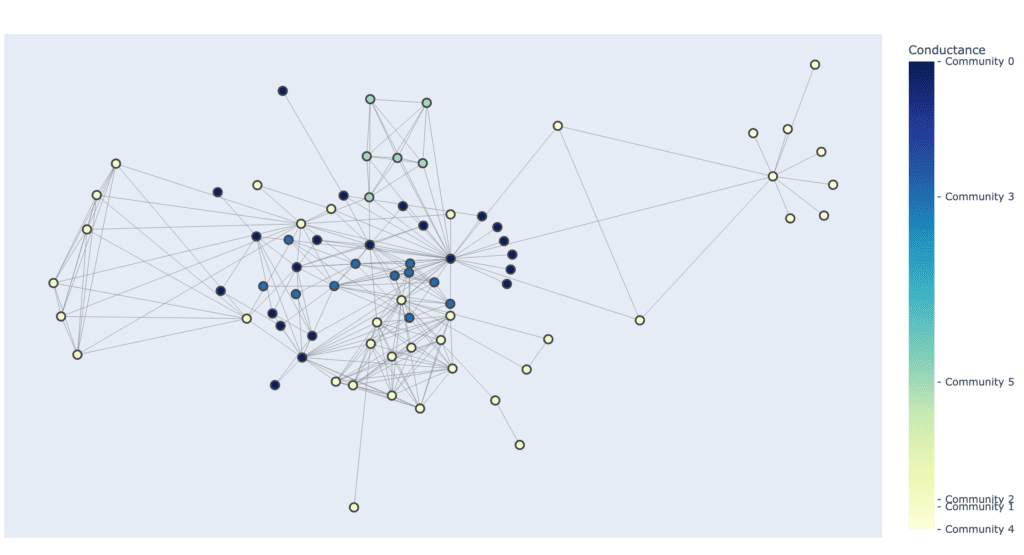
By expanding our visualization further to a single continuous scale, we are provided with an even better view into the how the conductances of each community compare with one another across the network. It also reveals a nuance of conductance as a metric, specifically that at its core it is a ratio of internal and external edges. This can be clearly seen by comparing nature of community 1 and community 4.
While both have relatively similar conductances, their structures and connections differ greatly. While community 1 still contains many external edges, it is counter balanced by the tight-knit nature of its many internal edges, meanwhile community 4 displays the exact opposite by having few internal edges but almost no external edges yet still resulting is a similar conductance score.
Conclusion
Conductance for graph community detection proves itself to be a powerful tool when quantifying patterns within network communities. In particular, it provides a method to explicitly measure whether a community is highly insular or interconnected with the rest of the network. However as we saw, conductance alone, like any metric, does not pain a full picture of a community’s structure. For a more complete understanding, those who utilize graphs as a data science tool can and should look to other methods, but that is a topic for a later blog, beyond the scope of just conductance / graph community detection.
Read Related Articles
- AI consulting guidebook
- AI in Drug Discovery – Harnessing the Power of LLMs
- What is Graph Data Science?
- What is Neo4j Graph Data Science?
- What are Graph Algorithms?
- Graph Traversal Algorithms (a.k.a Pathfinding algorithms)
- Pathfinding Algorithms (Top 5, with examples)
- Closeness Centrality
- Degree Centrality
- Betweenness Centrality
- PageRank
- Graph Embeddings (for more on graph embedding algorithms)
- LLM Pipelines / Graph Data Science Pipelines / Data Science Pipeline Steps
- What is Databricks? For data warehousing, data engineering, and data science
- Databricks Architecture – A Clear and Concise Explanation
- Databricks vs Snowflake compared
Also read this related article on graph analytics for more on analytics within the graph database context.
Graphable helps you make sense of your data by delivering expert analytics, data engineering, custom dev and applied data science services.
We are known for operating ethically, communicating well, and delivering on-time. With hundreds of successful projects across most industries, we have deep expertise in Financial Services, Life Sciences, Security/Intelligence, Transportation/Logistics, HighTech, and many others.
Thriving in the most challenging data integration and data science contexts, Graphable drives your analytics, data engineering, custom dev and applied data science success. Contact us to learn more about how we can help, or book a demo today.
We are known for operating ethically, communicating well, and delivering on-time. With hundreds of successful projects across most industries, we thrive in the most challenging data integration and data science contexts, driving analytics success.
Contact us for more information: