CONTACT US
What is Graph Data Science? A Complete Introduction to Critical New Ways of Analyzing Your Data
Graph data science is one of the hottest new fields in data science. Like the advent of classification algorithms a decade ago, it offers new methods to extract information from your data that would otherwise have been lost.
In this article, we’ll look at what is graph data science, how to think about it as a discipline, how to combine graph theory and data science using real-word data and problems, and what it looks like to integrate these techniques into your data science team.
What is Graph Data Science?
But what is graph data science? And how should we think about integrating it into our data science methods and teams? Simply put, graph data science (using Network Theory) is driven by the principle that more than just the data itself is important. That the connections and relationships within our data provide critically important insights in any analysis, insights that most data science methods are not inherently suited to leverage.
For example, we can learn more about the data from a networking event when we consider not only who is participating in it, but also with whom is the person interacting and subsequently how shared knowledge is spreading in that context.
Why Use Graphs at All?
Before diving into the details of graph data science, we must first contemplate why we as data scientists should focus on graphs (nodes and relationships) and graph databases in the first place (read about What is Graph Database?).
The answer generally boils down to one concept: the value and conclusions we can draw from the relationships between different data points. What Google and many other thought-leading organizations have found is that the format of the graph database data structures is far more effective for modern data science, when also utilizing Network Theory.
Graphs are a general language for describing and analyzing entities with relations/interactions
Jure Lescovek
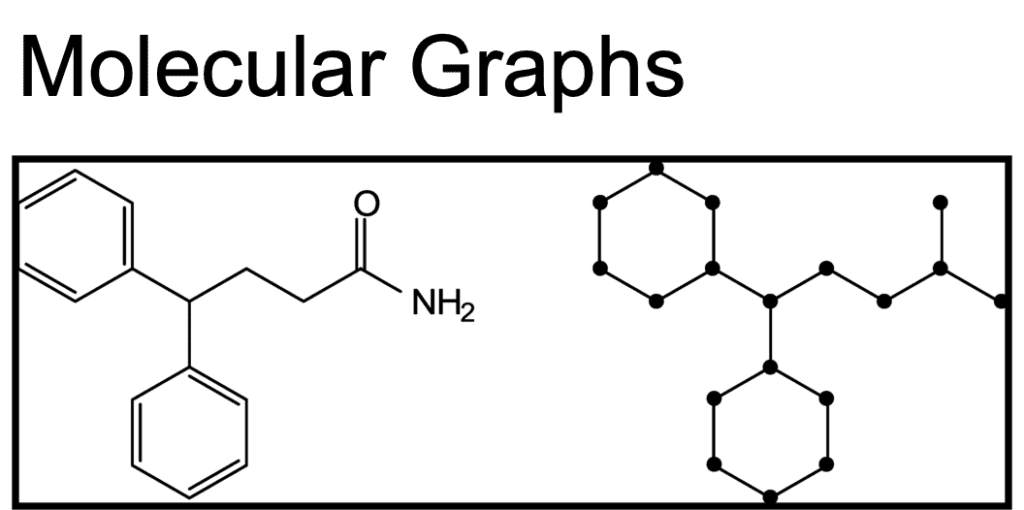
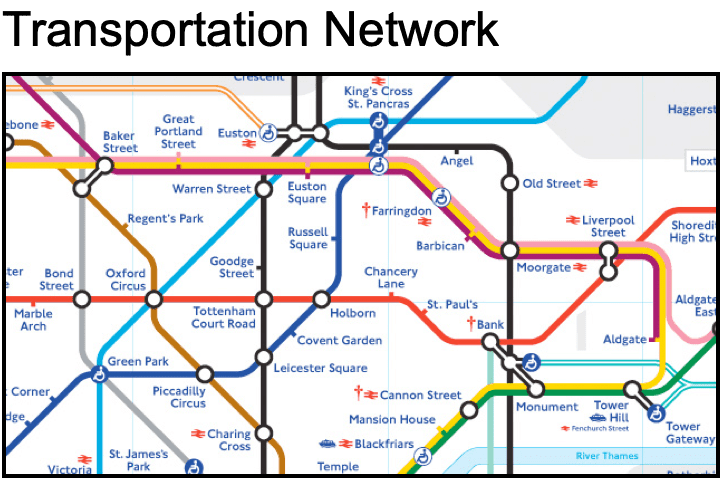
The above quote from Jure Lescovek, a leader in the graph machine learning space, puts it simply and elegantly. Graphs as a data structure provide a generalizable method to capture the interconnected nature which we find in many of the complex systems we encounter across domains. Because of this, we can use graphs to represent a variety of use cases and then model those connections with the analytical methods we apply to them as in the examples shown below:
Rather than compressing or reorganizing a complex system into more classical data structures which sacrifice performance and information in the process, we instead meet the complex system where it is and apply a data structure that models and accurately reflects the system in a way that is much closer to its natural state.
Once we’ve done this, we now have data that represents its real-world counterpart far more accurately and we are in a much better position to extract real and new valuable knowledge from that data, and draw out hidden, insightful conclusions.
Graph Data Science Tools
First and foremost it is important to recognize that graph data science is an emerging field and therefore the current set of tools for applying graph theory in data science is still in early in many ways. With that said, there are a significant number of tools now (some of which have been around for quite a long time) that provide data structures, functions, and models to get the most out of your data. Below are some examples:
Graph Data Structures AND lIbraries
Algorithms
Graph Machine Learning
Exploratory Data Analysis (EDA) for Graph Data
Before we can use any of the tools mentioned above to analyze or to model our graph data, we always recommend to first conduct some exploratory data analysis to get a strong understanding of the shape and nuances of the data which will be critical when we begin to run our analysis. Below I will cover the basics of EDA for graphs.
SIZE of the graph network
The first and most straightforward graph statistics we can examine are simple node and edge counts. This will give us an idea of the general size of our graph and aid in decisions about which algorithms will be appropriate for the network given its nature. For example, in large graphs with millions or even billions of nodes, some algorithms with more efficient computation times would be more appropriate while others which might perform poorly on much larger counts, may need to be reconsidered or the scope of the graph constrained.
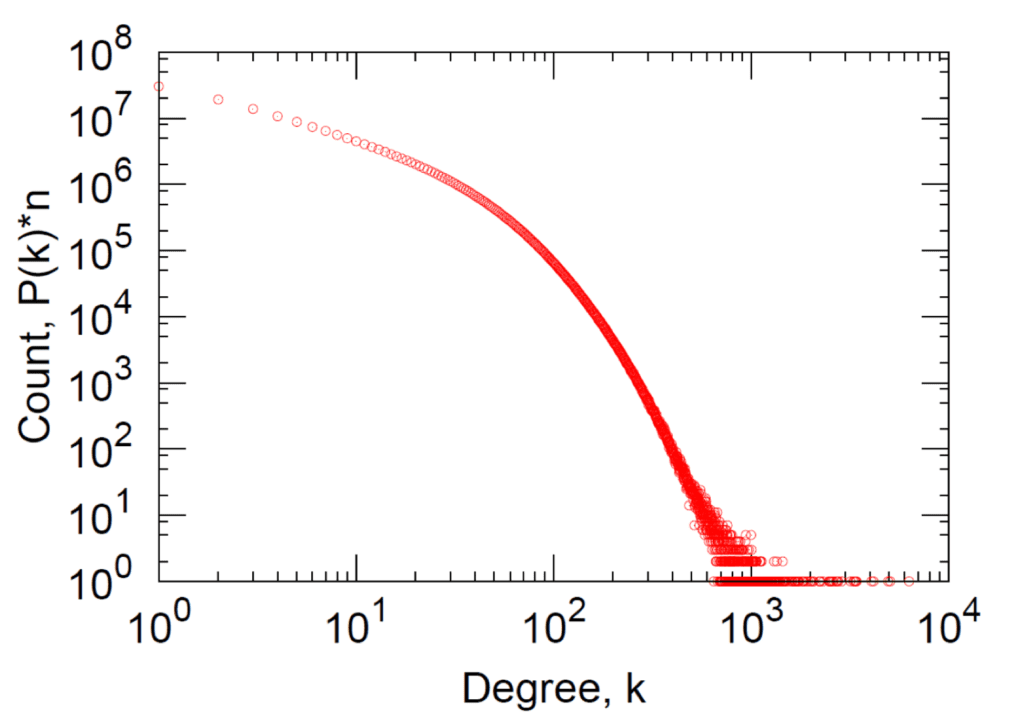
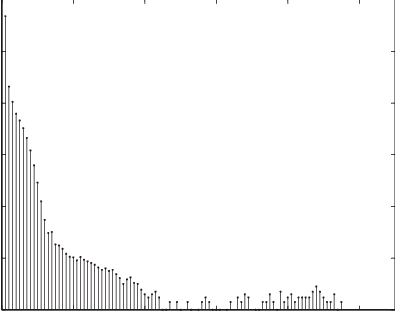
Degree distribution
The degree distribution of a graph provides a powerful descriptor to understand how connected nodes tend to exist. Real work degree distributions tend to follow a power-law distribution with most nodes having few connections and only the top percent of nodes having connections beyond this.
Edge weight distribution
Similar to the degree distribution, weighted networks allow us to also examine not just the number of connections a node has, but what is the weight that these connections have. This can be very helpful in understanding the real implications of a dataset where the weight of a relationship may represent the number of transactions between two accounts, or the number of trucks sent between two distribution centers. This can be especially helpful when weeding out noise which has the potential to skew results of any analysis you plan to run.
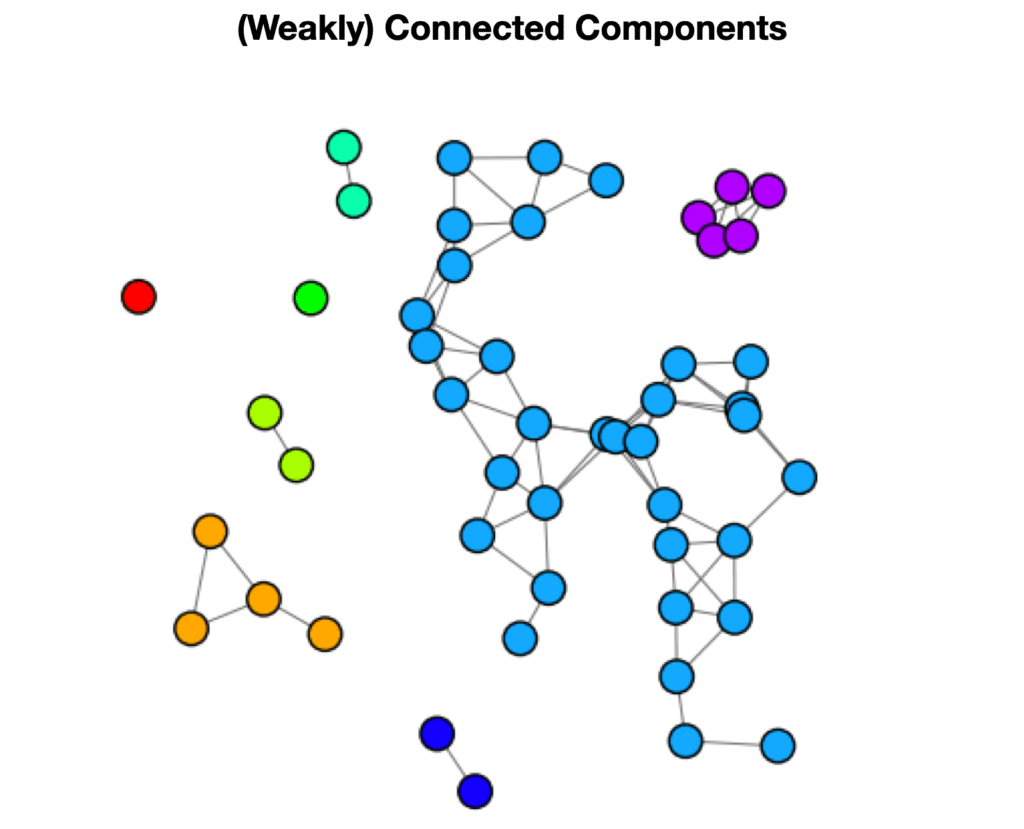
Component Analysis
Often one of the more overlooked steps in understanding graph data, but possibly one of the most important- component analysis- allows us to understand the type of graph (direct, indirect, cyclic, …) and how disconnected a given graph may be. A graph with many components or “islands” of nodes can be detrimental to some algorithms which rely on a fully connected graph, while some other algorithms account for this.
Because of these subtleties, it’s important to know both your data and the algorithms you are applying. Let’s look at the two ways we can conduct component analysis:
- Weakly connected components (WCC) or called more simply ‘connected components’ indicates how many distinct disconnected subgraphs are contained within a given network. In the example above we can see that we would have 8 components, each of which would have a component ID.
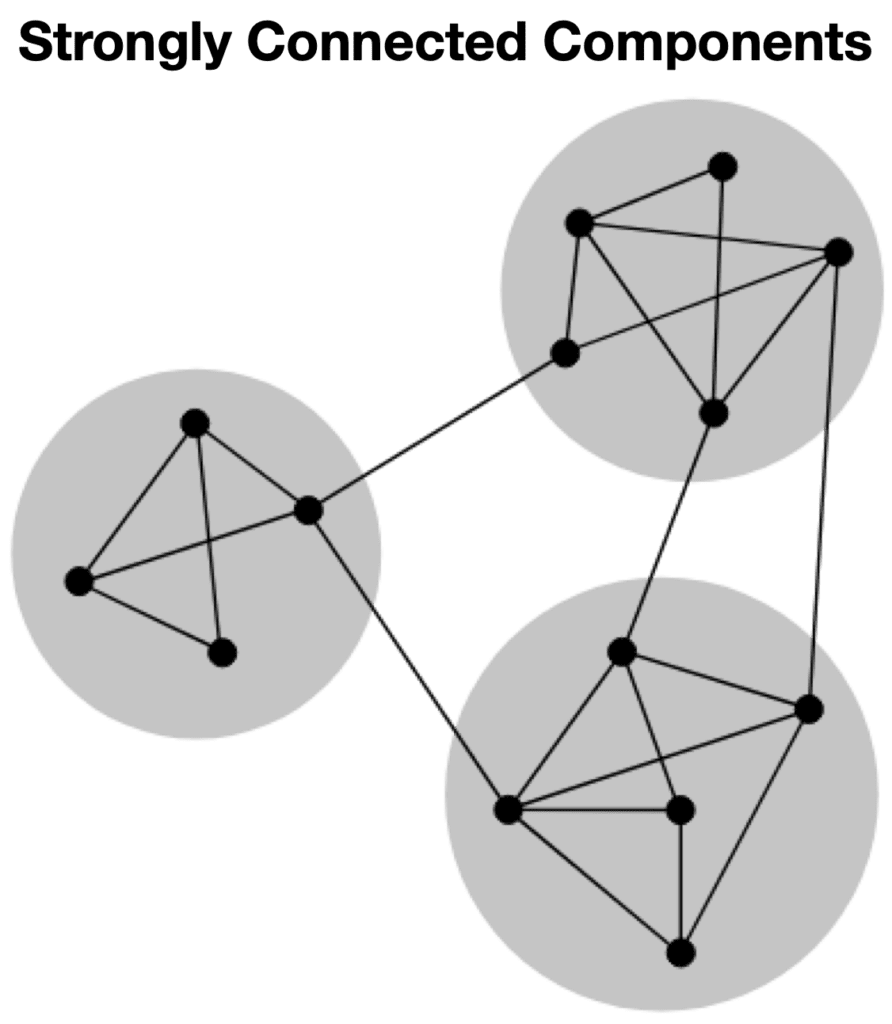
- Strongly Connected Components (SCC) modifies this idea by identifying components which are tightly coupled, even if they are weakly connected to other components in the graph. This can be especially useful when you have a fully connected graph but want to understand the high-level connected communities within it.
Graph Algorithms for Data Science
Graph algorithms are often the first stepping stone for many who venture into the world of graph data science and they range across a wide variety of use cases and purposes. There are countless books, blogs, and articles including our own on graph algorithms, all of which dive much deeper into each one of the algorithms. In this section however, I would like to provide some simple summaries to offer guidance around which algorithms to use in various contexts.
Pathfinding
Pathfinding allows us to better understand how two given nodes are related to one another. When examining which use cases can utilize pathfinding, look for scenarios where there is value in understanding how two given nodes are related to one another. These are also often referred to as Graph Traversal Algorithms.
Examples:
- Explaining how two members of a social network are related
- Understanding the complexity between two points in a supply chain
- Finding common biological pathways between two proteins
Centrality
When your use case calls for understanding how a single node compares globally to all others, consider using a centrality algorithm. This can be particularly useful when highlighting the key nodes in a very large network. Common algorithms in this class include the Betweenness Centrality and Closeness Centrality algorithms.
Examples:
- Highlighting influencers in a social media website
- Identifying key person risk in an organization
- Surfacing key airports in a flight network
Community Detection
Community Detection provides great value for use cases where insights can be gained by understanding how many nodes relate to one another in groups. Keep this in mind when a use case calls for the separation of a larger graph into subgraphs.
Examples:
- Detecting interconnected accounts in a ring of credit card fraud
- Finding groups of interrelated organisms in a food web
- Providing clusters of like-minded employees in a network of related skills
Integrating Graphs with Your Data Science Workbench
Lastly, we are bringing things full circle by looking at how this new group of graph data science capabilities fit into our existing data science workbench. This is where the value of graph data science really begins to shine as we go from running our graph algorithms or graph models in isolated “graph-y” workflows, and instead begin to blend them with other data science tools. Let’s look at two use cases to see some examples of how we can combine graph data science with existing analysis.
Feature Engineering
One of the simplest ways to integrate graph analysis into a traditional data science workflow is through feature engineering. By letting the connectivity of the graph provide additional context to a prediction, we can leverage that context to produce new features for our downstream models. This can also be used in conjunction with methods of graph embeddings where we allow the model to discover an additional set of features that are combined with other traditional features.
Document Modeling
As we covered in depth in our blog on document modeling in a graph machine learning pipeline (see article on Text to Graph Machine Learning), document embedding methods can be combined with graph embedding methods in order to harness the value from both, but in a single pipeline. This can allow a document to be understood not just by its own content, but how its content compares to that of other documents it may be related to.
Conclusion
In this article we looked at a high-level view of graph data science, how to think about its initial stages, and how to implement it into your own data science practice and methodology. Whether it be through leveraging algorithms to extract new details for a valuable use case or enhancing an existing data science workflow, graph data science offers a wide range of integrations with existing tools and capabilities- not to replace those data science techniques which we still need to rely on regularly, but rather to significantly enhance overall data science efforts with a new set of complimentary tools. Also read this related article on graph analytics.
If you are evaluating whether an AI-centered project may be a fit for your needs, read about whether an AI consulting partner is right for you to help evaluate the core criteria to decide, and even deliver your project.
Read Related Data Science / AI / LLM Articles:
- What are Graph Algorithms?
- Conductance Graph Community Detection: Python Examples
- What is Neo4j Graph Data Science?
- What is ChatGPT? A Complete Explanation
- ChatGPT for Analytics: Getting Access & 6 Valuable Use Cases
- Domo custom apps using Domo DDX Bricks with the assistance of ChatPGT
- Understanding Large Language Models (LLMs)
- What is Prompt Engineering? Unlock the value of LLMs
- LLM Pipelines / Graph Data Science Pipelines / Data Science Pipeline Steps
Graphable helps you make sense of your data by delivering expert data analytics consulting, data engineering, custom dev and applied data science services.
We are known for operating ethically, communicating well, and delivering on-time. With hundreds of successful projects across most industries, we have deep expertise in Financial Services, Life Sciences, Security/Intelligence, Transportation/Logistics, HighTech, and many others.
Thriving in the most challenging data integration and data science contexts, Graphable drives your analytics, data engineering, custom dev and applied data science success. Contact us to learn more about how we can help, or book a demo today.
Still learning? Check out a few of our introductory articles to learn more:
- What is a Graph Database?
- What is Neo4j (Graph Database)?
- What Is Domo (Analytics)?
- What is Hume (GraphAware)?
Additional discovery:
- Hume consulting / Hume (GraphAware) Platform
- Neo4j consulting / Graph database
- Domo consulting / Analytics - BI
We would also be happy to learn more about your current project and share how we might be able to help. Schedule a consultation with us today. We can also discuss pricing on these initial calls, including Neo4j pricing and Domo pricing. We look forward to speaking with you!
Graphable helps you make sense of your data by delivering expert analytics, data engineering, custom dev and applied data science services.
We are known for operating ethically, communicating well, and delivering on-time. With hundreds of successful projects across most industries, we have deep expertise in Financial Services, Life Sciences, Security/Intelligence, Transportation/Logistics, HighTech, and many others.
Thriving in the most challenging data integration and data science contexts, Graphable drives your analytics, data engineering, custom dev and applied data science success. Contact us to learn more about how we can help, or book a demo today.
We are known for operating ethically, communicating well, and delivering on-time. With hundreds of successful projects across most industries, we thrive in the most challenging data integration and data science contexts, driving analytics success.
Contact us for more information: