CONTACT US
Operationalizing the PageRank Algorithm: Protein-Protein Interaction Analysis
Watch our video below for a quick PageRank algorithm demonstration using a protein-protein interaction graph. Graphable Lead Data Scientist Sean Robinson explores how to operationalize centrality measures such as PageRank from the Neo4j graph data science (GDS). The GraphAware Hume knowledge graph platform delivers the value of graph-based analytics into the hands of everyday analysts and decision-makers in an easy-to-interpret visualization.
Learn more:
- Check out the code: coming soon
- Read our blogs
- About Graphable
- About Neo4j Graph Data Science
- Explore more protein-protein interaction graphs
Video Transcript: PageRank Algorithm (Protein-Protein Interaction Graph Example)
Today we’re going to operationalize the PageRank Algorithm with a protein-protein interaction graph example. We’ll be using the Clinical Knowledge Graph (CKG) to surface which proteins are most important within a given protein complex. Then we’ll see which biological processes are impacted by those most influential proteins.

Adding a Style With Graph Data Science Algorithms
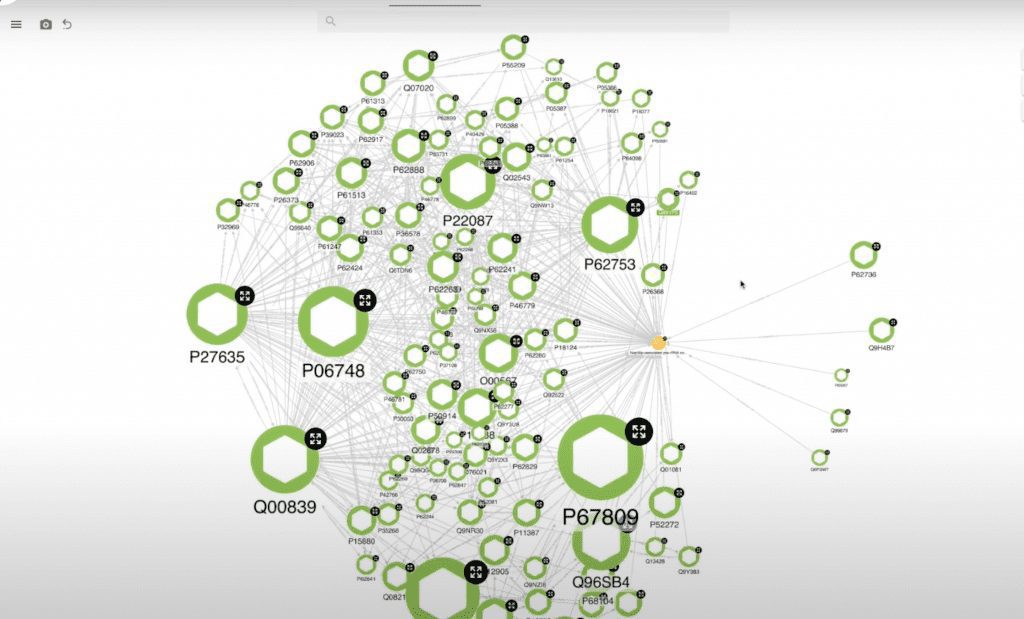
I’m going to start by looking up my complex in question. Let’s expand the proteins for this complex to see what our interaction network looks like. Here we can see a number of proteins, but there’s quite a bit of chaos to our visualization. Let’s put some order to that chaos using some graph data science algorithms.
I’m going to add a style to my proteins. Let’s base it on the size of the protein to help those most influential proteins stand out. I’m going to select my PageRank attribute, which I’ve previously calculated and written in my database so Hume will be able to access to it.
I’m going to have it relative to my visualization (rather than globally across my entire database) to keep things in context in terms of what I’m seeing on the screen. I’m even going to increase my size multiplier a bit so that those most influential proteins really stand out.
Now let’s add our rule: Our most influential proteins now stand out like a sore thumb, which is incredibly useful when we have a large, chaotic visualization.

Using Processes Action
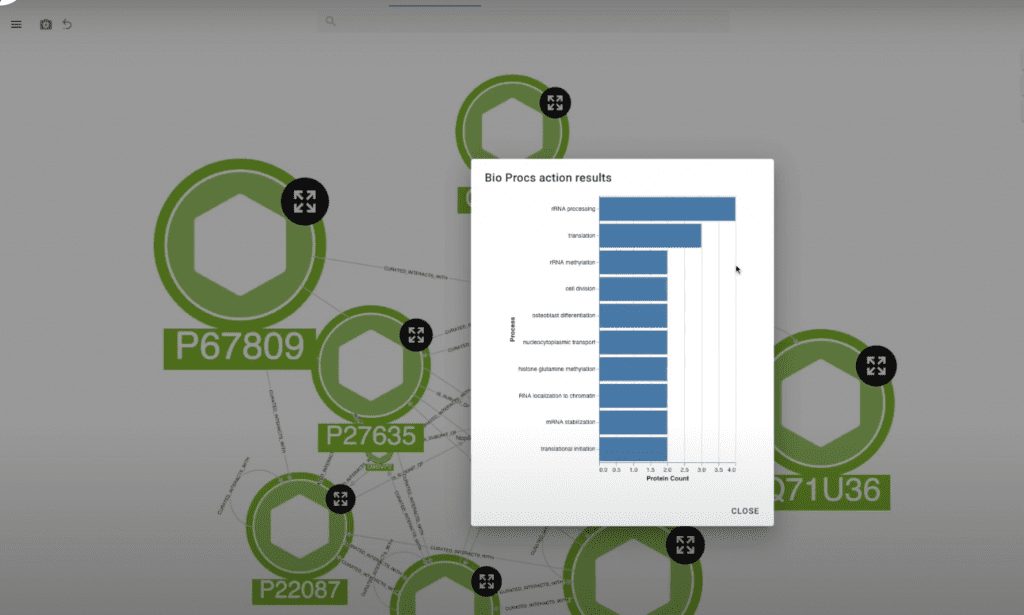
Let’s select those proteins and take a look at what processes they might be impacting. I’ll clear out the rest of my visualization. Now we have a much simpler picture of our most influential proteins. I’ll select all of those proteins and use my Processes action to see which biological processes they’re affecting.

So here we can see they’re impacting rRNA processing, translation, and a number of other biological processes. This can be incredibly useful when we’re trying to do something like targeted drug discovery for one of these processes.
So I hope this has provided useful insight into how to use your graph data science algorithms to filter and clean up your protein-protein interaction graph visualizations. I encourage you to think about what other visualizations and algorithms could be enhanced with the combination of the two. I look forward to seeing what you do!
Check out related articles on graph algorithms. For a deeper dive on these and other algorithms discussed here as well as more advanced graph topics, check out our additional articles on the subject:
- Graph Traversal Algorithms (a.k.a Pathfinding algorithms)
- Pathfinding Algorithms (Top 5, with examples)
- Closeness Centrality
- Degree Centrality
- Betweenness Centrality
- PageRank
- Graph Embeddings (for more on graph embedding algorithms)
Also read this related article on graph analytics for more on analytics within the graph database context.
Still learning? Check out a few of our introductory articles to learn more:
- What is a Graph Database?
- What is Neo4j (Graph Database)?
- What Is Domo (Analytics)?
- What is Hume (GraphAware)?
Additional discovery:
- Hume consulting / Hume (GraphAware) Platform
- Neo4j consulting / Graph database
- Domo consulting / Analytics - BI
We would also be happy to learn more about your current project and share how we might be able to help. Schedule a consultation with us today. We can also discuss pricing on these initial calls, including Neo4j pricing and Domo pricing. We look forward to speaking with you!


