CONTACT US
5 Compelling Examples of Graph Analytics Powering Better Decisions

Graph analytics is rapidly emerging as a powerful set of capabilities for unlocking valuable insights hidden within complex datasets. By leveraging advanced algorithms and techniques, graph analysis and graph data science enable organizations to analyze and visualize the relationships between different data points, providing a more complete understanding of their data than traditional methods allow. As data continues to grow in complexity and volume, graph analytics is becoming an increasingly important component of any data-driven organization’s toolkit, offering new ways to approach complex business challenges and drive better decision-making.
With graph analytics, decision-makers can go beyond simple data summaries and explore the underlying connections between different data points. By analyzing these connections, organizations can uncover new insights and opportunities that may have been overlooked or that they were unable to identify using traditional methods. Whether you’re trying to improve network performance, detect fraud, or provide personalized recommendations among just a few examples, graph analytics can help you make sense of your data and drive better business outcomes.
Graph Analytics for Identifying and Visualizing Complex Relationships
One of the key advantages of graph analytics is the ability to visualize complex relationships in an intuitive way. Graphs provide a visual representation of how different data points are interconnected, allowing decision-makers to quickly identify patterns and relationships that may have been difficult to see with other methods. This can help to uncover insights and opportunities that may have been missed using traditional data analysis techniques.
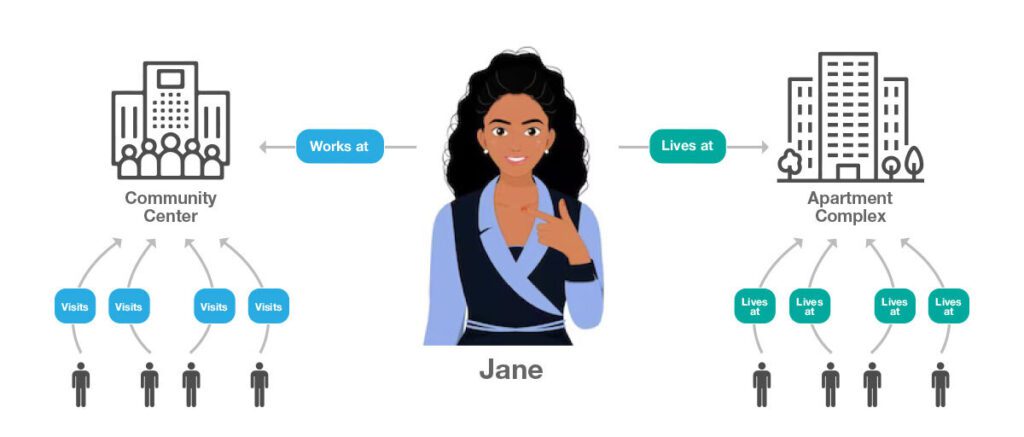
For example, imagine that you are analyzing data to attempt to do contact tracing for COVID-19 or another disease (see article on contact tracing graph database). Using traditional methods, you may be able to identify broad trends and patterns, such as which geographic areas are hot zones or which hospitals are most heavily infected. However, you may not be able to see the complex relationships between different data points, such as which people are associated to each other through work, neighborhood, schools attended, or other relationships. By modeling this data as a graph and using graph analytics, you can uncover these relationships and gain a deeper understanding of how disease spreads.
Detect Anomalies and Patterns with Graph Analysis
Graph analytics is a powerful tool for detecting anomalies and patterns within complex datasets. Traditional data analysis techniques often rely on statistical methods or simple aggregations to identify trends or outliers, but these methods may not be effective for identifying more complex patterns or anomalies. Graph analytics, on the other hand, can identify subtle relationships and correlations that may not be visible using traditional methods.
One way that graph analytics can detect anomalies and patterns is by analyzing the relationships between different data points. By modeling data as a graph, graph analytics can identify patterns of connections and relationships that may indicate anomalies or outliers within the data. For example, if a particular data point is connected to a large number of other data points, this may indicate that it is a key node within the graph and warrants further investigation.
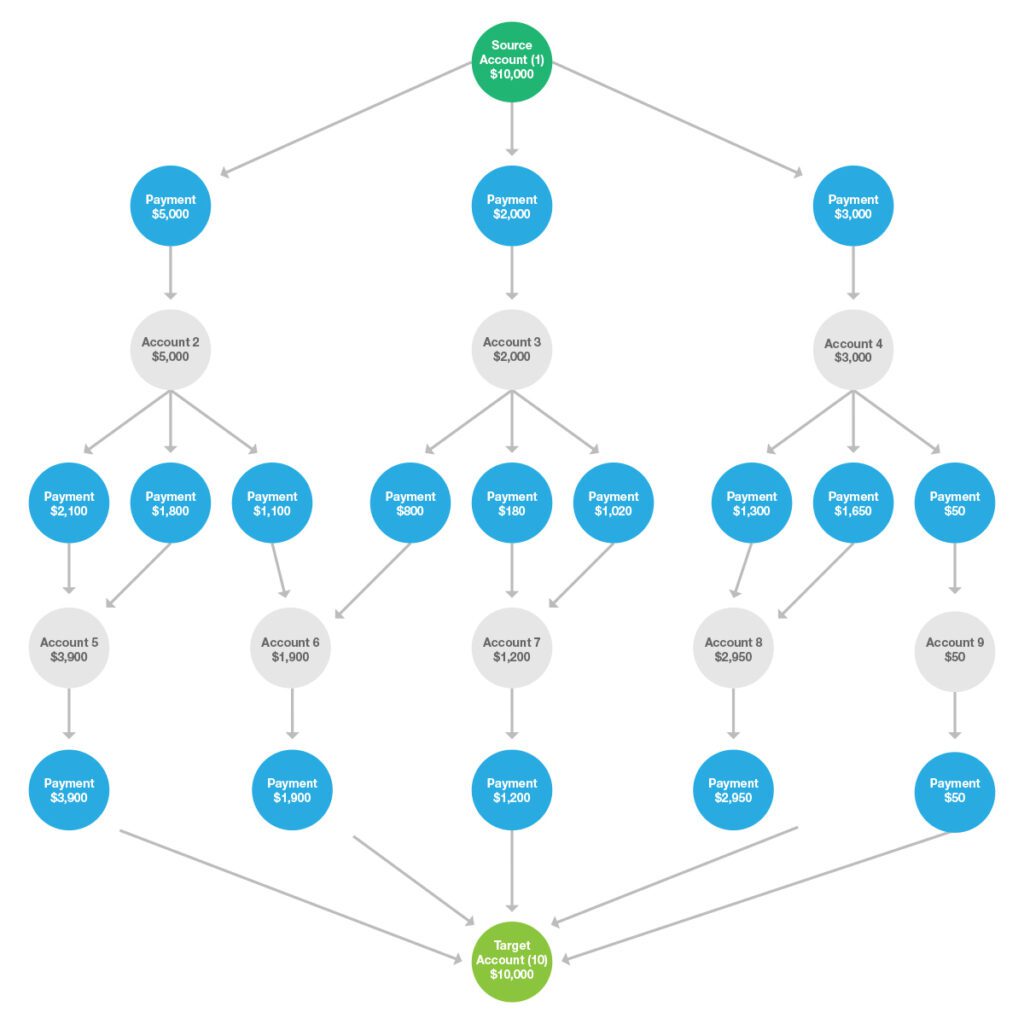
Another way that graph analytics can detect anomalies and patterns is by using graph algorithms and machine learning techniques. For example, you can use anomaly detection algorithms as a type of graph analysis to identify data points or relationships that deviate from expected patterns. This can help to identify potential risks or opportunities that may have been missed using traditional data analysis techniques. A common use case is fraud detection (see graph database fraud detection, also shown above), which Graphable has leading-edge experience implementing.
Enable Personalized Recommendations
Personalized recommendations have become a crucial component of many businesses, from e-commerce websites to streaming services. By analyzing a user’s behavior and preferences, businesses can provide more relevant and accurate recommendations, leading to higher customer satisfaction and sales. Graph analytics can be a powerful tool for enabling personalized recommendations by identifying patterns in user interactions that can power building recommendation engines in a meaningful way.

By modeling user behavior as a graph, graph analysis can identify relationships between different products or services and the user’s interactions with them. This can help to identify patterns of behavior or preferences that may not be immediately apparent using traditional data analysis techniques. By using this information, businesses can provide more targeted and relevant recommendations to their customers, leading to a better customer experience.
For example, imagine that you run an e-commerce website that sells home and bedding type products. By using graph analysis to analyze user behavior, you may identify that users who purchase a particular type of pillow are also likely to purchase a certain brand of sheets. This information can be used to provide more targeted recommendations to these users, suggesting shoes that are likely to be of interest to them. This can lead to a better shopping experience for the user, and ultimately, higher sales for the business.
Improved Network Management
Network management is a complex task that requires a deep understanding of the relationships between different nodes within the network. Graph analytics can be a powerful tool for optimizing network management by analyzing these relationships and identifying potential issues or opportunities for improvement.
One example of a network that can benefit from graph analytics is a social network. By modeling a social network as a graph, graph analytics can identify patterns of connections and relationships between different users. This can help to identify key influencers within the network, potential areas of conflict, or opportunities for collaboration.
Another example of a network that can benefit from graph analytics is a supply chain network. By modeling a supply chain as a graph, graph analytics can identify the relationships between different nodes, such as suppliers, manufacturers, and distributors. This can help to identify potential bottlenecks, inefficiencies, or opportunities for optimization.
In both cases, graph analytics can help to improve overall network performance by optimizing communication and collaboration between different nodes. For example, by identifying key influencers within a social network, businesses can focus their marketing efforts on these users to maximize their impact. Similarly, by identifying potential bottlenecks in a supply chain network, businesses can work to optimize their processes and improve overall efficiency.
Enhance Predictive Analytics with Graph Algorithms
Predictive analytics is a powerful way of making data-driven decisions, but it can be challenging to build predictive models that take into account the complex relationships between different variables. Graph data science and associated graph algorithms can be powerful for enhancing graph analytics by modeling data as a graph and analyzing the relationships between different data points.

One example of a powerful graph data science algorithm that can be used to enhance predictive analytics is PageRank. Originally developed by Google for ranking web pages, PageRank can also be used to identify key nodes within a graph based on their connections to other nodes. This can help to identify influential data points or variables within a dataset, which can then be used to build more accurate predictive models.
Another example of a powerful category of graph data science algorithms that can enhance predictive analytics are community detection algorithms (e.g. Louvain, Surprise, Leiden, Walktrap etc). Community detection algorithms can identify groups of nodes within a graph that are highly interconnected, which can help to identify patterns or clusters within a dataset. This can be used to build more accurate predictive models by identifying groups of data points that are likely to behave similarly.
By using graph algorithms to enhance predictive analytics specifically, businesses can build more accurate predictive models and make better decisions based on these predictions. This can lead to improved outcomes and a competitive advantage in the marketplace.
Conclusion
Graph analysis is a powerful tool for businesses looking to make better data-driven decisions. By modeling data as a graph and analyzing the relationships between different data points, businesses can uncover hidden insights and make more informed decisions.
From identifying complex relationships to detecting anomalies and patterns, graph analytics can drive value that is not easily attainable with traditional methods. By enhancing predictive analytics, businesses can also build more accurate models and make better decisions based on these predictions.
Contact Us today to schedule a data analytics consultation and learn more about how we can help you achieve your business goals using graph analytics on a free trial of cutting-edge software from our partners Neo4j and GraphAware Hume. Our team of experienced data scientists and graph experts can help you unlock the power of graph analytics and take your data-driven decision-making to the next level.
If you are evaluating whether an AI project will be a fit for your needs, read about whether an AI consulting partner is right for you to help evaluate and deliver your project.
Graphable helps you make sense of your data by delivering expert data analytics consulting, data engineering, custom dev and applied data science services.
We are known for operating ethically, communicating well, and delivering on-time. With hundreds of successful projects across most industries, we have deep expertise in Financial Services, Life Sciences, Security/Intelligence, Transportation/Logistics, HighTech, and many others.
Thriving in the most challenging data integration and data science contexts, Graphable drives your analytics, data engineering, custom dev and applied data science success. Contact us to learn more about how we can help, or book a demo today.
Still learning? Check out a few of our introductory articles to learn more:
- What is a Graph Database?
- What is Neo4j (Graph Database)?
- What Is Domo (Analytics)?
- What is Hume (GraphAware)?
Additional discovery:
- Hume consulting / Hume (GraphAware) Platform
- Neo4j consulting / Graph database
- Domo consulting / Analytics - BI
We would also be happy to learn more about your current project and share how we might be able to help. Schedule a consultation with us today. We can also discuss pricing on these initial calls, including Neo4j pricing and Domo pricing. We look forward to speaking with you!
Graphable helps you make sense of your data by delivering expert analytics, data engineering, custom dev and applied data science services.
We are known for operating ethically, communicating well, and delivering on-time. With hundreds of successful projects across most industries, we have deep expertise in Financial Services, Life Sciences, Security/Intelligence, Transportation/Logistics, HighTech, and many others.
Thriving in the most challenging data integration and data science contexts, Graphable drives your analytics, data engineering, custom dev and applied data science success. Contact us to learn more about how we can help, or book a demo today.
We are known for operating ethically, communicating well, and delivering on-time. With hundreds of successful projects across most industries, we thrive in the most challenging data integration and data science contexts, driving analytics success.
Contact us for more information: