CONTACT US
Digital Dashboards: 4 Design Tactics for Improved Insights
Digital dashboards are an essential capability for businesses looking to make informed decisions, optimize their operations, and identify areas for improvement.
However, architecting the necessary data infrastructure and designing effective digital dashboards can be a daunting task. With an unending amount of data and metrics to choose from, it can be difficult to narrow down which metrics to feature prominently and how to present them.
That’s why we’ve compiled this list of four digital dashboard design tips to help you optimize your insights, encourage data curiosity, and drive business growth through your BI solutions.
Building Digital Dashboards That Matter to Your Users
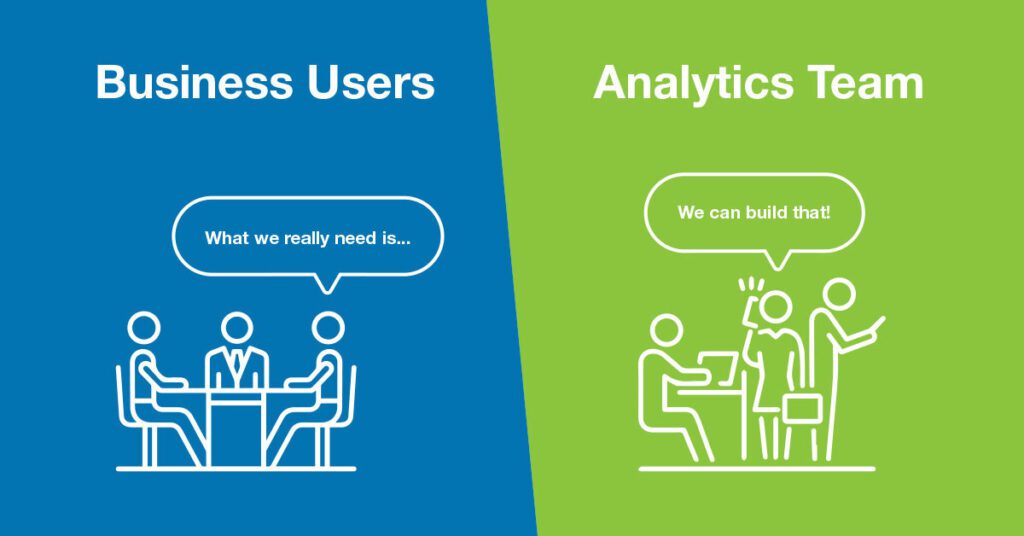
Building a digital dashboard that delivers value to your users starts with understanding their needs. Knowing who your users are and what data they require on a day-to-day basis can help you build a digital dashboard that is tailored to their unique needs.

One effective way to understand your audience is to conduct surveys, interviews, or round table discussions with future dashboard end-users. This can help you gather insights on their data needs, how they consume data, and the contexts in which they use the data insights. Reach out to a Business Intelligence Consultant if you’re interested in getting hands-on guidance for this step of the process.
Identify and Focus on What Impacts the Business
Identifying the key metrics often requires a deep understanding of your business and industry. It is essential to have a clear understanding of the metrics that drive your business’s success, and to effectively measure these metrics. But that’s not enough.
Ultimately, the key to generating business value from data is connecting the dots between what drives your business, how you can measure your drivers, and who needs to be given the insights gained from that information in order to go out and make an impact.

Before jumping right into designing dashboards – take the time to understand your business and connect the dots for your stakeholders. By focusing on presenting the right metrics, with the best dashboard design, to the appropriate audience – you can create powerful tools that drive better decision-making and enable innovation.
Creating Digital Dashboards That Are Visually Appealing and Easy to Use
The visual appeal and intuitiveness of a digital dashboards are just as crucial as the actual functionality. Effective digital dashboards strike a balance between aesthetics and technical abilities to create useful and easy-to-use analytics.

When it comes to aesthetics, it’s essential to use colors and design elements that are consistent with your brand and easy on the eyes, but also be careful to not use color without specific purpose to drive insight. For a deep dive on design and aesthetics that drive understanding, check out the most well-known book on the topic by Steven Few, Information Dashboard Design: The Effective Visual Communication of Data.
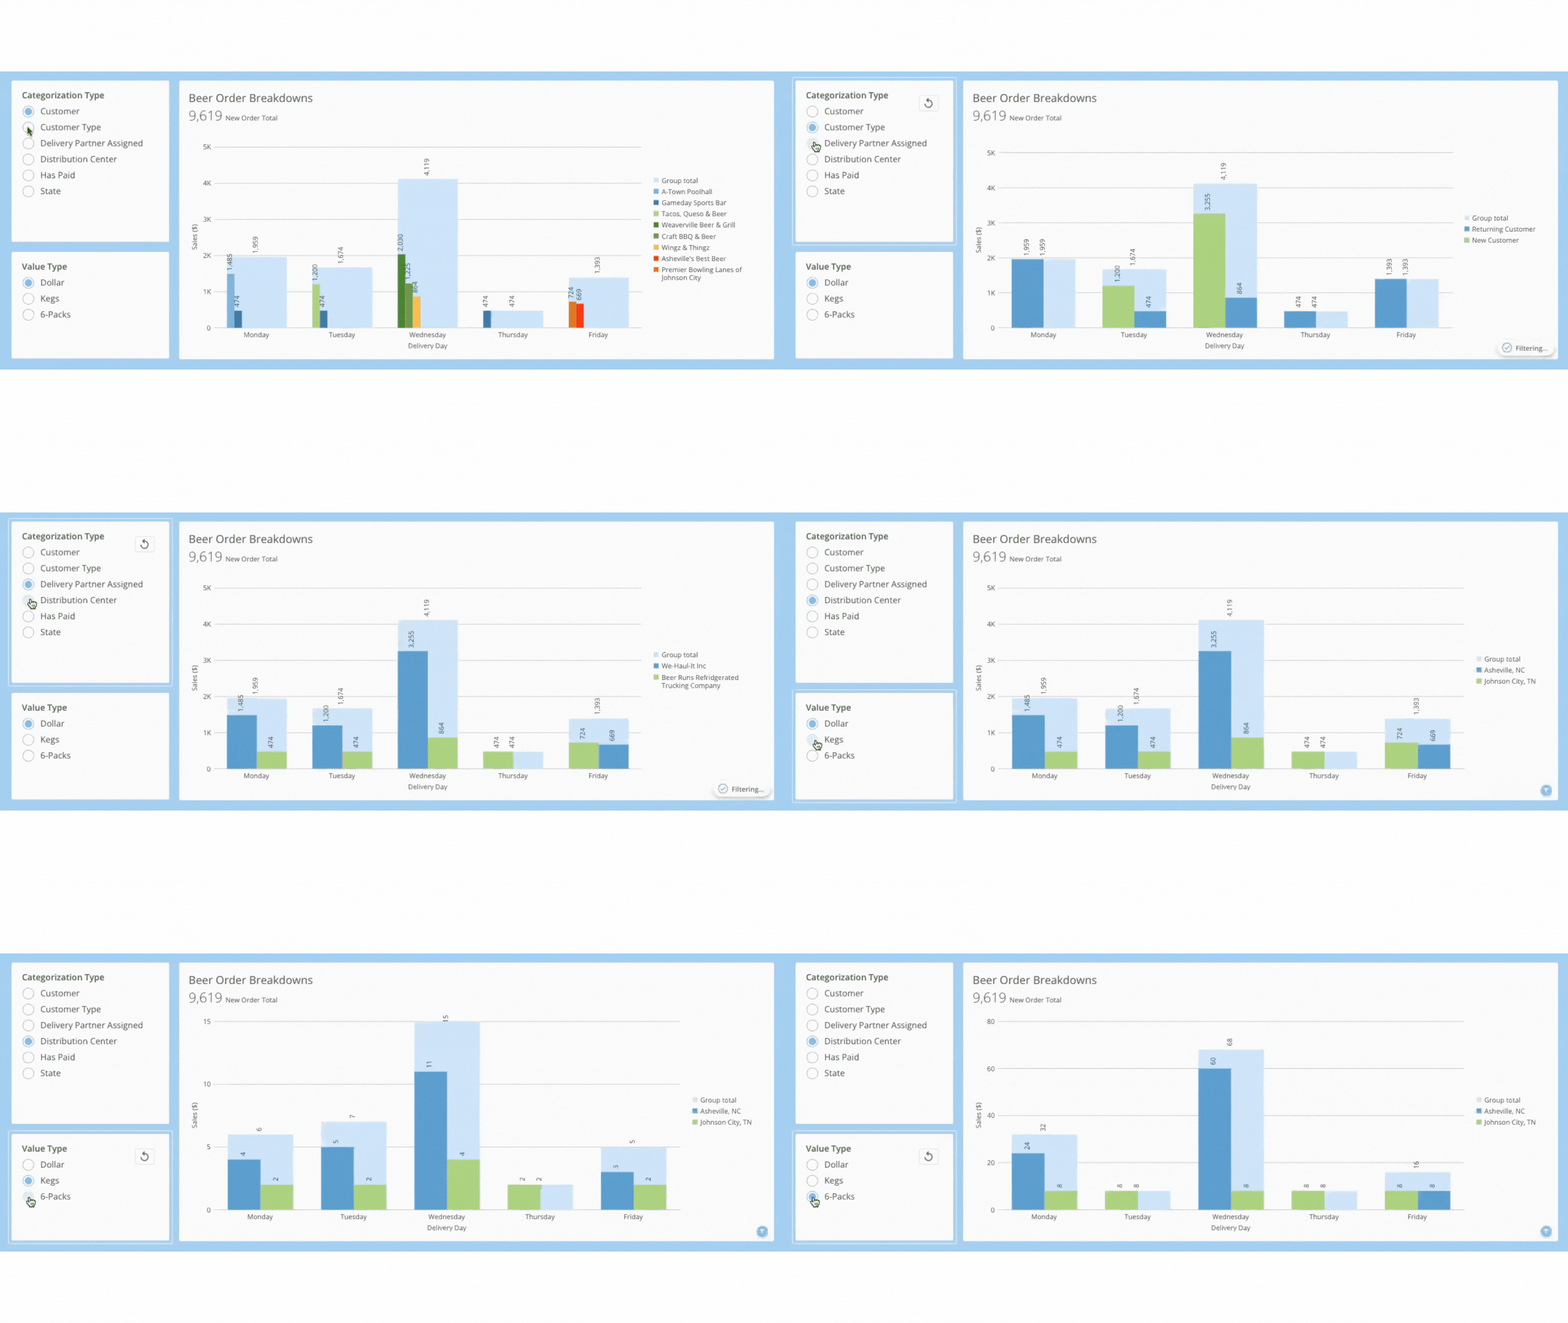
Functionality is equally important when designing digital dashboards. Utilizing interactive elements like Domo Variables combined with drill capabilities to use Domo Analyzer can both improve functionality by making the dashboard more engaging and enhance visual appeal by reducing the need for redundant charts and clutter.
Choose the Right Tools and Technology
When designing a digital dashboard, selecting the right software and tools is critical to ensure the dashboard functions effectively and efficiently. Numerous software options are available, each with distinct features and capabilities.
When considering analytics / business apps platforms, it’s important to consider the data sources necessary for the dashboard, the visualization options available, and the automation capabilities. Investing in a platform that enables automated data and dashboard updates based on real-time or near real-time connections minimizes the need for manual, time-consuming updates.
This is where Domo really thrives thanks to capabilities like Magic ETL, Analyzer, 1,000+ prebuilt connectors, and Domo custom connector capability.
Overall, the right software can turn your digital dashboards from just a collection of data into a powerful capability for driving decisions and innovation. It’s important to choose the appropriate software that can fully support your desired dashboard capabilities, and the team here at Graphable would love to assist you in this journey!
Conclusion
By building digital dashboards that truly matter to your users by focusing on the most core metrics, balancing aesthetics with functionality, and selecting the right platform and capabilities, businesses can harness the power of data and analytics to make much more informed decisions efficiently, and in time to make a difference.
That being said, creating optimized digital dashboards isn’t easy. That’s where the Graphable team comes in!
An optimized analytics / data platform can provide a powerful competitive advantage to businesses, making data accessible to everyone and powering differentiating decision making. Reach out to our expert team so we can work with you to understand your key business objectives, design digital dashboards tailored to your teams’ unique needs, and provide ongoing data strategy leadership for your ensured success.
Related Articles
- Domo vs Tableau – What are the differences?
- Learn the difference between Domo vs Power BI
- Domo demo video
- What makes a great business intelligence consultant?
- Best BI solutions?
- What is Domo analytics?
- The Domo Platform
- Domo dashboards
- Dashboarding – what it is is and how to begin
- What are digital dashboards?
- Domo maps,
- Domo analyzer (KPI builder and ad hoc UI)
- Domo Workbench
- Domo custom connector – how to
- Build a Domo JSON connector
- Domo variables
- Domo everywhere
- Create a Domo app
- Crafting an Effective Business Intelligence Strategy
- Domo data visualizations
- The power of Business Intelligence Services
Also check out these helpful new articles: What is ChatGPT?, Analytics for ChatGPT, and What is Text Analytics?
Still learning? Check out a few of our introductory articles to learn more:
- What is a Graph Database?
- What is Neo4j (Graph Database)?
- What Is Domo (Analytics)?
- What is Hume (GraphAware)?
Additional discovery:
- Hume consulting / Hume (GraphAware) Platform
- Neo4j consulting / Graph database
- Domo consulting / Analytics - BI
We would also be happy to learn more about your current project and share how we might be able to help. Schedule a consultation with us today. We can also discuss pricing on these initial calls, including Neo4j pricing and Domo pricing. We look forward to speaking with you!


