CONTACT US
Domo Maps: Create Your 1st Geo Map

Building apps that utilize geo maps has historically been the domain of deeply technical mapping experts. With Domo maps, it is much simpler for users to leverage geo mapping for their business, even easily including them on a Domo dashboard.
Drag-and-Drop Domo Maps
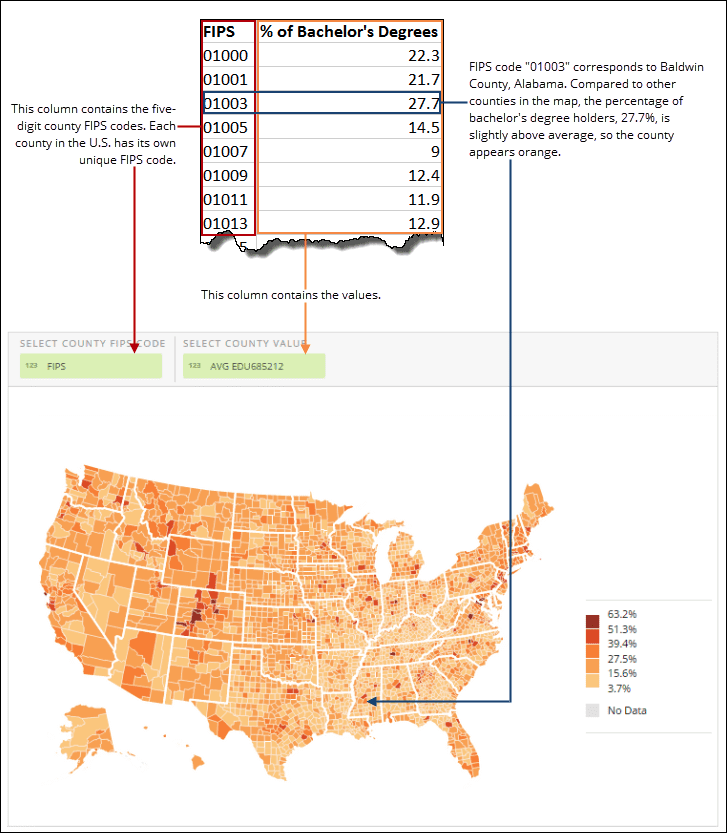
In Domo there are a whole host of easy drag-and-drop maps available that any business user can deploy. Of course they include areas such as countries, provinces/states, counties and zip codes, but they also support out-of-the box lat-long maps and even lat-long route maps as well. Below is an example of how to easily configure a Domo county map:
Below is a great step-by video provided by Domo showing exactly how this works using the US states example:
There is also a great Domo University article on this if you want to know more about it, including a list of built-in Domo chart options with maps.
What About Advanced Map Development?
Although there are Mapbox alternatives (e.g. Google Maps, ESRI etc) when using Domo or when developing in any other app context, Mapbox has a lower barrier to entry from a licensing and ease-of-use perspective. And combined with the ease of creating a Domo app, developers can more simply and elegantly incorporate advanced maps and map use cases right into their Domo apps.
Also, with the advent of Domo’s custom charts and custom map regions there is even more one can do without any coding at all, but some of the advantages of creating these custom maps are being able to map multiple points and series in both geo and non geo contexts (e.g. sales reps and opps), as well enabling you to create custom and specific coloring by different series, as well as providing additional information via the plotted points (e.g. popups data).
To get started creating your first more advanced map / integration, create a free Mapbox account, which gives you access to both Mapbox Studio and Mapbox GL JS for building web maps and for embedding them in applications. Mapbox Studio is a suite of applications for designing custom map styles and managing your location data (e.g. one can import all the data with have full design control with no coding required). Mapbox GL JS is a JavaScript library for interactive, rich maps with storytelling, querying, point clustering, locational analysis and much more.
To get started, with Mapbox GL JS, you’ll need to install the npm package wherever you will be utilizing it for dev or production (e.g. inside Domo app environment).
npm install --save mapbox-gl
If you are using a CSS loader like webpack css-loader, you can import the CSS directly in your JavaScript.
import 'mapbox-gl/dist/mapbox-gl.css';
Next, you need the following code block to add a map to your page:
mapboxgl.accessToken = '<your access token here>';
const map = new mapboxgl.Map({
container: 'map', // container ID
    style: 'mapbox://styles/mapbox/streets-v11', // style URL
    center: [-74.5, 40], // starting position [lng, lat]
    zoom: 9 // starting zoom
    const SCHOOL_DISTRICT_TILESET_URL = 'mapbox://graphable.3ewbs0gi' //tileset URL
});
Below is an explanation of each element of the code above:
- accessToken: This Mapbox access token associates your Mapbox GL JS map with a Mapbox account.
- container: The HTML element in which the map will be placed. In the example below, this element is the <div> with an ID of “map”.
- style: The style URL of the map style being used to determine which tilesets the map includes and how they are styled. The example above uses the Mapbox Streets v11 style.
- center: The coordinates of the map’s starting position, in longitude, latitude order.
- zoom: The zoom level at which the map should be initialized. This can be a whole number or a decimal value.
- const: see below.
If copying this for your own map exercise, you may want to comment out the last line of code like so, as it is unique to this example:
// const SCHOOL_DISTRICT_TILESET_URL = 'mapbox://graphable.3ewbs0gi' //tileset URL
In Mapbox, the style is uniquely important as it defines the structure and physical appearance of the map. There are several styles to start with, all of which you can customize in Mapbox Studio.
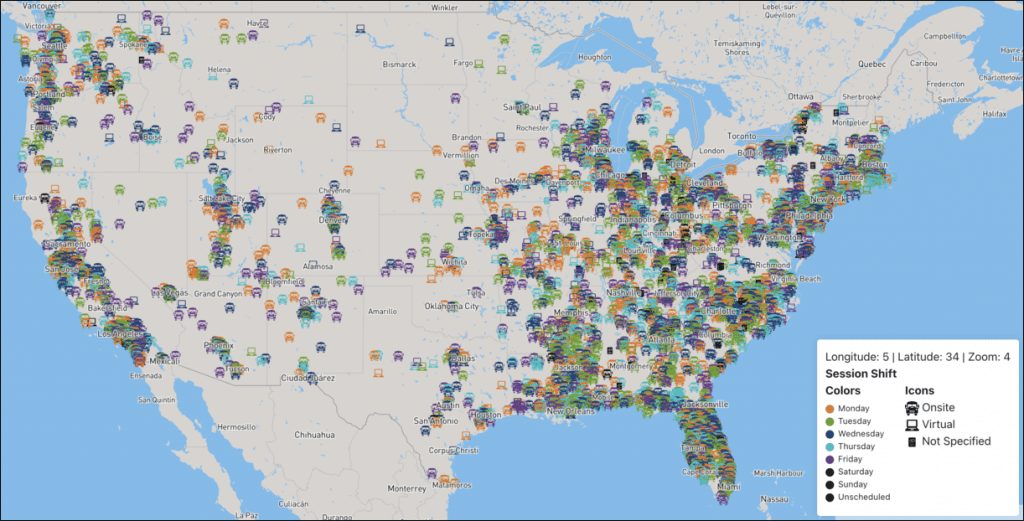
Above, we have included a custom tileset called ‘SCHOOL_DISTRICT_TILESET_URL’ to use as an example. Tilesets like this are the primary data source used to power maps. A tileset is a collection of raster or vector data broken up into a uniform grid of square tiles and are used in Mapbox libraries and SDKs as a core element in making any map display. Below is the output of the above example:
You can use the default tilesets Mapbox provides, or you can create custom tilesets as in the example above. For this tileset, we downloaded a US School District Boundaries shapefile from the US Government, converted the data to .geojson filetype (using Mapbox studio) and then to .mbtiles format and uploaded it to our Mapbox account (for more details on how to do this, follow this post). Custom tilesets enable you to map places or boundaries that Mapbox does not already have in their library, in ways that are not possible with Domo’s custom regions capability.
Using the above approach, you can render a map in minutes and begin to develop your application, adding layers, points, boundaries and more.
If you are not familiar with how to build a Domo app in which to embed your custom Domo maps, you can find out more at developer.domo.com.
Conclusion
There are many ways to create Maps in Domo and really in any app building context or platform. The examples above show how to create a map in the simplest of ways using built-in, drag-and-drop capabilities in Domo, through how to create highly customized maps for any use case, in this case leveraging Mapbox for Domo and other platforms (even though there are many good Mapbox alternatives including Domo Google Maps being the most common). Curious about Domo pricing? Graphable has all the details.
Interested in how graph databases can make your maps / geospatial even more valuable? Follow the link to read our introductory article on graph database geospatial analysis.
For more on analytics and Domo-specific information, check out a Domo demo video and also these articles: What is Domo analytics?, the Domo Platform, Domo dashboards (and dashboarding in general), this one on BI Reporting, Domo analyzer (KPI builder and ad hoc UI), Domo Workbench, build a Domo JSON connector, Domo variables, Domo everywhere, create a Domo app,
Also check out these helpful new articles: What is ChatGPT?, Analytics for ChatGPT, and What is Text Analytics?
Graphable helps you make sense of your data by delivering expert data analytics consulting, data engineering, custom dev and applied data science services.
We are known for operating ethically, communicating well, and delivering on-time. With hundreds of successful projects across most industries, we have deep expertise in Financial Services, Life Sciences, Security/Intelligence, Transportation/Logistics, HighTech, and many others.
Thriving in the most challenging data integration and data science contexts, Graphable drives your analytics, data engineering, custom dev and applied data science success. Contact us to learn more about how we can help, or book a demo today.
Still learning? Check out a few of our introductory articles to learn more:
- What is a Graph Database?
- What is Neo4j (Graph Database)?
- What Is Domo (Analytics)?
- What is Hume (GraphAware)?
Additional discovery:
- Hume consulting / Hume (GraphAware) Platform
- Neo4j consulting / Graph database
- Domo consulting / Analytics - BI
We would also be happy to learn more about your current project and share how we might be able to help. Schedule a consultation with us today. We can also discuss pricing on these initial calls, including Neo4j pricing and Domo pricing. We look forward to speaking with you!
Graphable helps you make sense of your data by delivering expert analytics, data engineering, custom dev and applied data science services.
We are known for operating ethically, communicating well, and delivering on-time. With hundreds of successful projects across most industries, we have deep expertise in Financial Services, Life Sciences, Security/Intelligence, Transportation/Logistics, HighTech, and many others.
Thriving in the most challenging data integration and data science contexts, Graphable drives your analytics, data engineering, custom dev and applied data science success. Contact us to learn more about how we can help, or book a demo today.
We are known for operating ethically, communicating well, and delivering on-time. With hundreds of successful projects across most industries, we thrive in the most challenging data integration and data science contexts, driving analytics success.
Contact us for more information: