CONTACT US
Target Protein Interaction Exploration With Hume [Video]
Knowledge graphs are used for a wide range of applications in science and healthcare. In this expert talk, Graphable Lead Data Scientist Sean Robinson leads us through a biology graph database use case with a target protein interaction exploration. We’ll look at protein-to-protein interactions, explore key protein structures and visualize relationships between target proteins and associated drugs.
Video: Target Protein Interaction Exploration
Transcript: Target Protein Interaction Exploration With Hume on Neo4j
Today, I’m excited to look at a biology use case featuring a target protein interaction exploration. We’ll use a clinical knowledge graph built on Neo4j and visualized using the Hume knowledge graph platform.
Specifically, we’ll explore how a cancerous protein interacts with other proteins. Our knowledge graph will help us identify which protein interactions pertain to enzymatic activity.
Visualizing Protein-to-Protein Interactions With Hume
We’re going to start by looking up the protein in question, ERBB2. Here we have all the isoforms of ERBB2. Let’s bring them together into a single group so we can see them more easily on our clinical knowledge graph.

Now that I have my group of proteins, let’s expand its protein-to-protein interactions to create a full PPI network. We’ll start with the outbound PPIs in our database, then we’ll bring in any inbound PPIs. Now we have a full protein-to-protein interaction network.
Next, I’ll enable auto-link and expand the biological processes for my ERBB2 group. That will help us see which biological processes are linked to these proteins.

Now we have an interesting set of graphs with proteins that interact with the biological processes on the left and everything else on the right.
Next, let’s clear out the other proteins to only show those that share the biological processes I’m interested in (i.e., enzymatic activity). So I’m going to do a local search for any biological processes that pertain to enzymes.

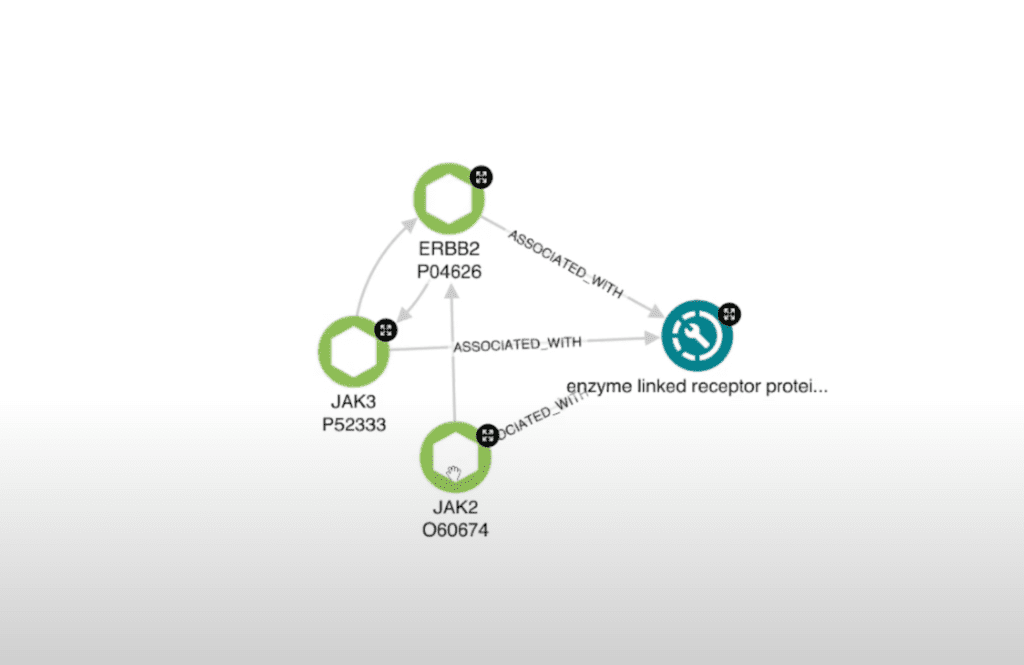
Here I have an enzyme-linked receptor biological process. So let’s get all of the proteins that pertain to that biological process by clearing out any extraneous related biological processes. Now we’re down to only those that we’re interested in investigating.

Examining Protein Structures in 3D
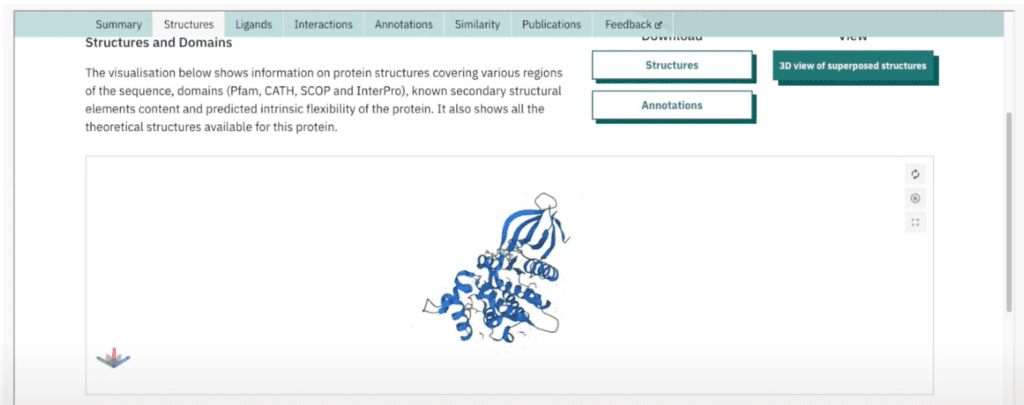
Let’s take a look at JAK proteins and see how they look. Here, I’m reaching out to an external tool that we’re able to surface as an iframe within Hume. This allows us to actually investigate the 3D structure of a given protein and evaluate other auxiliary metrics that might be relevant to a researcher.
We can do the same for JAK2. Let’s examine its 3D protein structure and take note of any other information the tool might offer us.
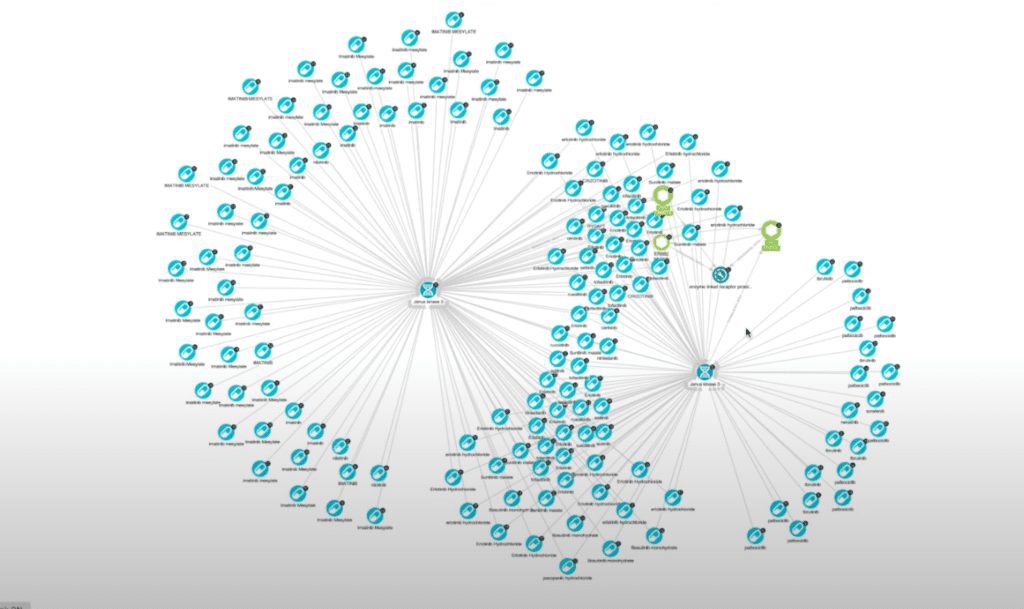
Next, I want to look at the drugs that have been associated with these protein structures. I’m going to look at my “Show Target Drugs” action and pull up which drugs have been associated with these genes.

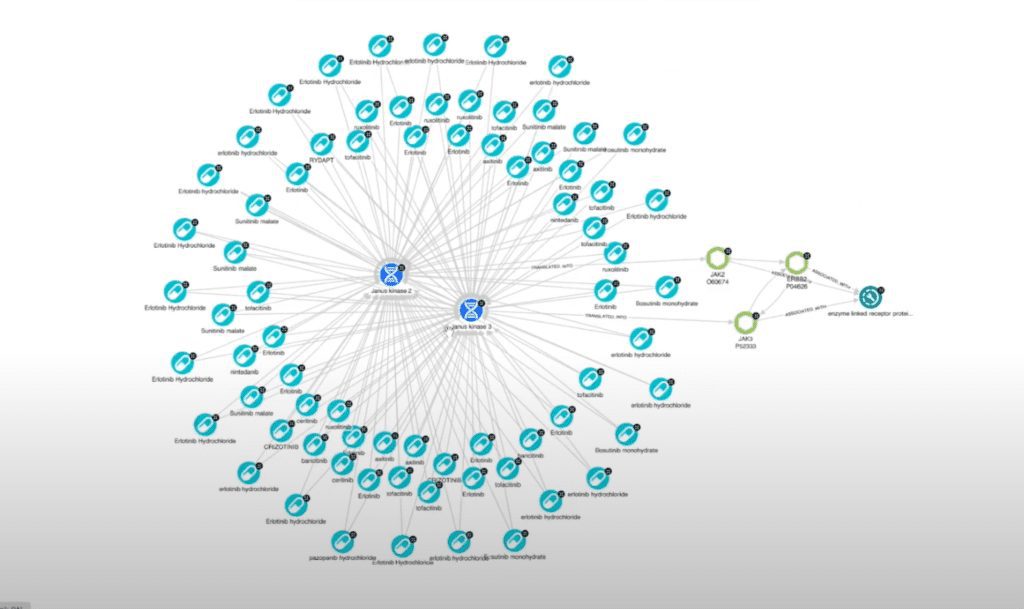
Now I have a list, and we can see there’s some overlap between the two genes. Let’s go back and re-run my action using the intersection filter so we can only see the drugs that interact with both proteins.

That populates a diagram of drugs and proteins that we can do a couple of things with this. First, I’m going to select all of my proteins and generate a report that I can export and share with other people if needed.
We can export this list of all of our proteins, genes and drugs as a CSV or an Excel file. We can also add the individual proteins we’re interested in to a collection.
Saving and Sharing Protein Visualizations
Next, I’m going to add them to my “Targets to Test” collection where I can keep any potential protein targets I’m interested in. And last, we’ll use the Hume snapshot feature to capture our visualization.
I’ll call this “My Enzyme Exploration”, give it a description and then click “Save”. Now I have this available to view as an individual snapshot of data I’ve found. I can go in, move things around and have a static image of the visualization I want.
I can also create a shareable link then drop it in a Slack or Teams channel or an email, making it easy to collaborate with other researchers who might be interested in my discovery.
In summary, we started our target protein interaction exploration with a particularly interesting target protein. We looked at its vast PPI network and then narrowed that large number of proteins down to just a few that meet the criteria I’m interested in investigating.
I hope this sparks ideas for how you can apply the Hume platform on the Neo4j graph database to your drug discovery workflows or scientific research.
Check out additional Neo4j use cases including a contract tracing graph database, exploring bike data using Uber H3 Grid System, and graph databases in pro sports, and graph database fraud detection and also read this related article on graph analytics.
Still learning? Check out a few of our introductory articles to learn more:
- What is a Graph Database?
- What is Neo4j (Graph Database)?
- What Is Domo (Analytics)?
- What is Hume (GraphAware)?
Additional discovery:
- Hume consulting / Hume (GraphAware) Platform
- Neo4j consulting / Graph database
- Domo consulting / Analytics - BI
We would also be happy to learn more about your current project and share how we might be able to help. Schedule a consultation with us today. We can also discuss pricing on these initial calls, including Neo4j pricing and Domo pricing. We look forward to speaking with you!


