CONTACT US
Next-Gen Basket Analysis With Graph

For any company that sells products or services, basket analysis should be core to its business insights and strategy. Understanding what gets purchased together is critical to so many aspects of the business, from CRM to new product development.
As customers move to primarily buy online, the ability to personalize the customer experience through a recommendation engine to dynamic pricing and promotions, understanding customer behavior through basket analysis is indispensable. Despite many companies’ significant investments in technology and infrastructure for basket analysis, not that many see the healthy return on that investment that they expected.
Gaining Insight From Basket Analysis
One thing we continue to see as a barrier to basket analysis ROI is the way organizations leverage their results. Usually, these end up in a table of “association rules”. From the outset, basket analyses are fairly complex processes that require many transformations from point-of-sale data to mine association rules of co-purchased products. Interpreting these rules is a complex and directional problem.
For example, Product A and Product B might be purchased together most frequently. Delving deeper, we see that when Product A is in basket, there is a 70% chance of Product B being bought as well. But, when Product B is in the basket, there is only a 20% probability of Product A being there too. This is because not all products are purchased in equal quantities, raising the question of whether Product A was driving Product B or vice versa.
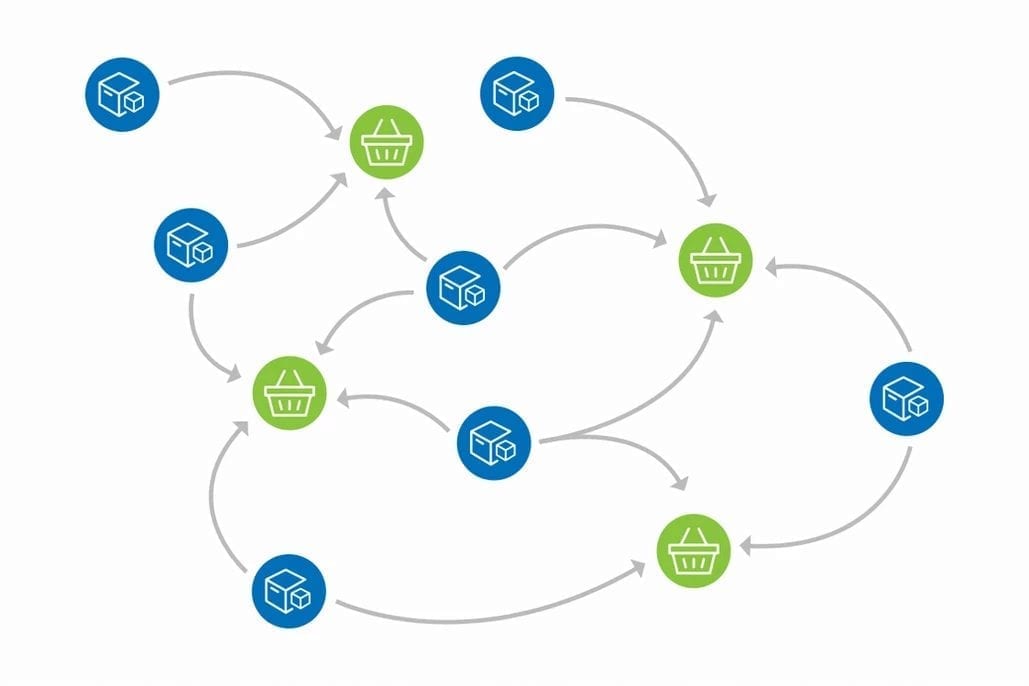
Further complicating matters, if the product or service assortment is large, the number of possible combinations in the basket grows exponentially and the statistical significance of the rules is degraded, reducing the value of the insight. With many low probability rules, important insights are lost when the analyst must read down many, many rows while keeping in mind the connections between products.
Extracting insights from these rare rules becomes nearly impossible given the complex relationships that make up the many combinations of products that make up customer transaction patterns. Solving these problems requires a method of data storage and analysis that allows these complex relationships to be stored, managed, and analyzed to provide insight to the analysts to drive business strategy.
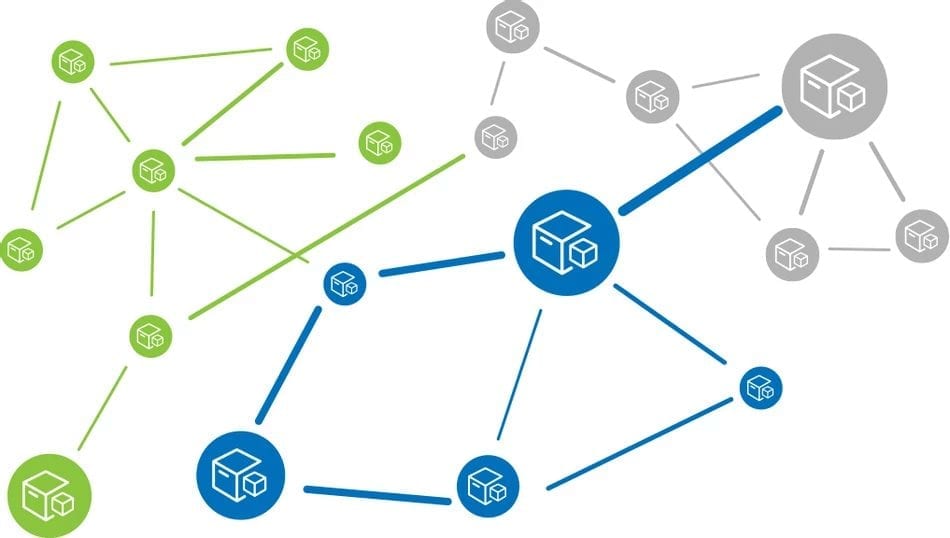
Direct Access to Data in Graphs
Although association rules are a good start, having a disembodied table of relationships between products still leaves many questions unanswered. How much revenue does the most popular basket generate? What is the profit margin on that basket? What are the common product attributes that make this basket so popular?
Answering these questions would mean having the analyst go back to the point-of-sale data, then going over to the product database to pull attribute and cost data. This problem can be solved by using a graph database because it can contain all the necessary information in one place. The graph is able to combine product information with point-of-sale, connecting individual products and all their attribute data with point-of-sale information such as promotions, discounts, and revenue, while still performing across this highly interconnected data, at scale.
Graph Analytics for Key Product Statistics
Beyond providing easy access to data, graphs are especially powerful if additional statistics are computed on hidden patterns within the association rules. There are many different algorithms to help find these hidden insights.
As one example, clustering algorithms let you see if there are naturally occurring families of products that seem to play well together. Alternatively, you could find products with the highest potential to lift other products, while at the same time look for opportunities to optimize your assortment and sunset products that don’t fit.
In addition, one of the exciting aspects of graph analytics is the ability to track the evolution of a product network over time. By storing each basket network over multiple time windows, we have the ability to detect subtle changes in customer preferences for different basket combinations.
Product Attributes
Knowing what products get purchased together is only part of the solution. Understanding the drivers behind successful product assortments is even more critical to future success. By running your basket analysis against a graph database, the product attributes that play well together and also drive the biggest and most profitable baskets can be detected and determined.
Beyond product attributes, customer ratings and reviews built into the database enable the determination of the product characteristics that resonate best with your customer base. Combining all these (usually siloed) data sets in a single place creates a platform of insights from which broader strategies around CRM, advertising, marketing, and promotions can be defined. The next generation of basket analysis goes beyond just filling baskets to instead being a core component of our organizational strategies.
Graphable helps you make sense of your data by delivering expert data analytics consulting, data engineering, custom dev and applied data science services.
We are known for operating ethically, communicating well, and delivering on-time. With hundreds of successful projects across most industries, we have deep expertise in Financial Services, Life Sciences, Security/Intelligence, Transportation/Logistics, HighTech, and many others.
Thriving in the most challenging data integration and data science contexts, Graphable drives your analytics, data engineering, custom dev and applied data science success. Contact us to learn more about how we can help, or book a demo today.
Still learning? Check out a few of our introductory articles to learn more:
- What is a Graph Database?
- What is Neo4j (Graph Database)?
- What Is Domo (Analytics)?
- What is Hume (GraphAware)?
Additional discovery:
- Hume consulting / Hume (GraphAware) Platform
- Neo4j consulting / Graph database
- Domo consulting / Analytics - BI
We would also be happy to learn more about your current project and share how we might be able to help. Schedule a consultation with us today. We can also discuss pricing on these initial calls, including Neo4j pricing and Domo pricing. We look forward to speaking with you!
Graphable helps you make sense of your data by delivering expert analytics, data engineering, custom dev and applied data science services.
We are known for operating ethically, communicating well, and delivering on-time. With hundreds of successful projects across most industries, we have deep expertise in Financial Services, Life Sciences, Security/Intelligence, Transportation/Logistics, HighTech, and many others.
Thriving in the most challenging data integration and data science contexts, Graphable drives your analytics, data engineering, custom dev and applied data science success. Contact us to learn more about how we can help, or book a demo today.
We are known for operating ethically, communicating well, and delivering on-time. With hundreds of successful projects across most industries, we thrive in the most challenging data integration and data science contexts, driving analytics success.
Contact us for more information: