CONTACT US
Lessons from the Pandemic: Graph-Powered Organizational Agility

Implementing change has already proven to be essential to the success of any organization in the digital age. The COVID-19 pandemic has truly shown us how important organizational agility is, especially in the face of unprecedented events. Brick-and-mortar retailers have had to suddenly shift to selling predominantly online, financial services companies have been faced with the task of supporting a cashless and touch-less world, scores and scores of flights have been cancelled, hotels left have been left empty. The growing “graveyard” of bankruptcy filings in the wake of COVID-19 is a stark reminder that the ability to adapt is critical. This article addresses how to leverage graph technology for making data-driven decisions and action a powerful catalyst for organizational change.
Agility Requires Interconnected Insights and Actions
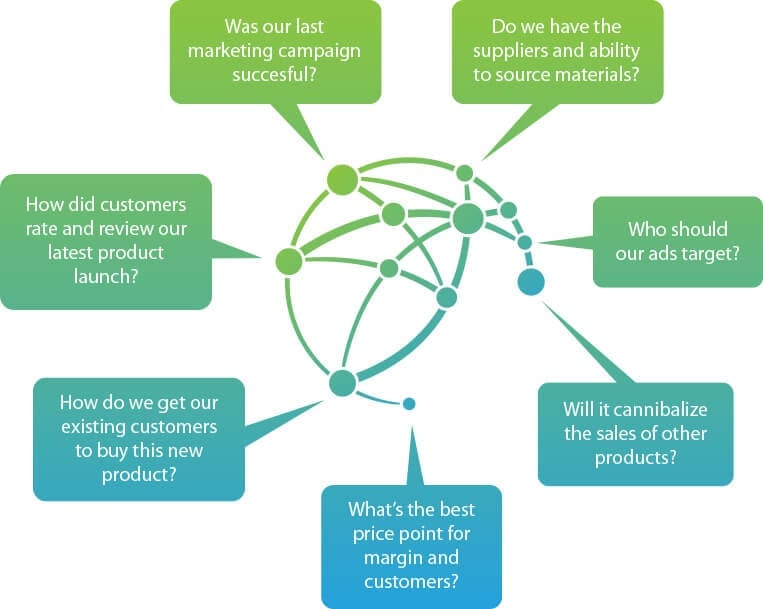
There is a tendency to assume that the size of an organizational is a barrier to change, but even the smallest startup can struggle to implement organizational change. We have found that the most significant barrier to agility is the silos that prevent interconnected problems from being understood and addressed concurrently. Virtually every business function that is viewed in isolation automatically forces it into a silo, regardless of whether its functions impact another dimension or department of the organization. For example, CRM strategy impacts marketing and advertising. New product development has to consider customer reviews of existing products, while simultaneously being conscious of potential supply chain disruptions. Pricing has to consider all of the above and at the same time, keep cannibalization of other products to a minimum.
Siloed Data = Siloed Organization
Working in silos is much like the ,,parable of the blind men and the elephant– each person is often blindly guessing at the overall state of affairs being informed only by the data directly in front of them. Yet, it is still common practice for different teams in an organization to have data in Excel sheets that have been extracted from a database and manipulated with a bunch of less-visible equations and often dependent on various tabs and sheets. Collaboration within the team tends to work well enough, but hand-offs to other teams work less well, requiring whole meetings and projects to align on the integration and interpretation of the data, not to mention having to compress the data into visualizations that then get pasted into a PowerPoint slides for executive decision-making. All this additional work creates bottlenecks and delays, significantly impacting agility in the process.
Unfortunately using Excel sheets as a primary means to work with and understand organizational data is a most common practice. The information is often shared from one employee to another, and with each degree of separation from the source, understanding how the data made its way into the Excel sheets becomes increasingly difficult, and is often completely lost. Yet, Excel sheets in many ways seem like a necessarily evil because of their “schemaless” architecture. Cells can be merged, colored, and labeled, allowing data to be moved around easily and aggregated. Fields can be absent or present, without any requirements for governance or pre-determined limits on values. While this flexibility seems valuable on the surface, this Excel-based approach builds virtual silos around the people who built the sheets and pulled the original data. On the surface, the portability of Excel files seems like an agile approach. In reality, the real outcome is the creation of even more data silos as Excel sheets proliferate and are shared, edited, updated, and re-shared across the enterprise over and over.

Graph as a Data Agility Solution
Addressing data silos does require a schemaless approach that has flexibility where needed, but also one that provides rigor and governance as well. Change agility is a business process problem in need of a technological solution, and here is where graphs can help to solve the data silo problem in a more responsible and scalable fashion. Graphs enable organizations to store data from different sources and types in a single connected store. Instead of having to think of data in terms of a highly structured rows and columns format for storing in relational tables, graphs solve this problem through their inherent “schemaless” nature. What this means is that a graph can handle very different kinds of data as well as the relationships between that data. Graphs can treat unlike data as entities with relationships that can be weighted, for example, a situation where product A and product B are related, but only share 80{7c478396bc638e1b367c1cdd71e6a4462e1023627948adc0f53064aaf7e33cc9} of the same materials. A graph can contain things as different as product hierarchies, process flows, bill of materials, and customer data, all in the same place and all interconnected.
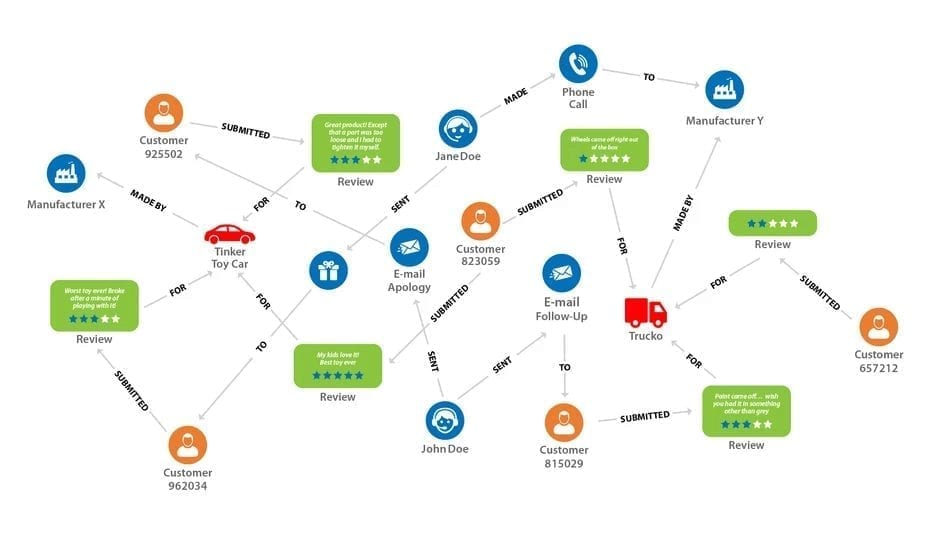
Those complex and ungoverned Excel sheets can easily be transformed into graph representations, with an example above showing the way entities can be interrelated in a graph. This works because the “knowledge graph” reflects the way companies and people act, think, remember, and convey information. For example: a company sourced materials, manufactured a product, found channels to sell it; a customer bought a product, had an experience, rated the product, and employee responded to issues. All of this can be easily represented as a connected set of experience in a graph. Graphs have an added benefit of revealing hidden relationships, for example, with the customer that bought a great product who also had a really bad experience with another product. An example of what can become apparent via the graph, is that all the bad reviews could be pointing to the same manufacturer, or perhaps even some problematic source material common to a set of products.
The most interesting part about a graph solution is that it essentially has something for every different part of the organization. Vendor management gets to see which manufacturer’s products are doing better (or worse). Customer service can see which customers have complained and what problems have been addressed and how those complaints may connect back to parts of the company they are less familiar with (e.g. material sourcing). Merchant teams can see how their assortment is doing and even marketing can leverage customer reviews to focus their upcoming campaigns. Instead of a one-size-fits-all approach, knowledge graphs can be reshaped to fit the needs of different groups, helping to break the data silos down. Without the need for fitting into inflexible relational schemas and by not requiring complex data transformations and joins, graphs give more people across our organizations the ability to explore and interpret secured data from across the enterprise in a shared fashion, using the same platform, reducing the endless “silo translation” meetings and rogue Excel data sources and calculations.
Graphable helps you make sense of your data by delivering expert data analytics consulting, data engineering, custom dev and applied data science services.
We are known for operating ethically, communicating well, and delivering on-time. With hundreds of successful projects across most industries, we have deep expertise in Financial Services, Life Sciences, Security/Intelligence, Transportation/Logistics, HighTech, and many others.
Thriving in the most challenging data integration and data science contexts, Graphable drives your analytics, data engineering, custom dev and applied data science success. Contact us to learn more about how we can help, or book a demo today.
Still learning? Check out a few of our introductory articles to learn more:
- What is a Graph Database?
- What is Neo4j (Graph Database)?
- What Is Domo (Analytics)?
- What is Hume (GraphAware)?
Additional discovery:
- Hume consulting / Hume (GraphAware) Platform
- Neo4j consulting / Graph database
- Domo consulting / Analytics - BI
We would also be happy to learn more about your current project and share how we might be able to help. Schedule a consultation with us today. We can also discuss pricing on these initial calls, including Neo4j pricing and Domo pricing. We look forward to speaking with you!
Graphable helps you make sense of your data by delivering expert analytics, data engineering, custom dev and applied data science services.
We are known for operating ethically, communicating well, and delivering on-time. With hundreds of successful projects across most industries, we have deep expertise in Financial Services, Life Sciences, Security/Intelligence, Transportation/Logistics, HighTech, and many others.
Thriving in the most challenging data integration and data science contexts, Graphable drives your analytics, data engineering, custom dev and applied data science success. Contact us to learn more about how we can help, or book a demo today.
We are known for operating ethically, communicating well, and delivering on-time. With hundreds of successful projects across most industries, we thrive in the most challenging data integration and data science contexts, driving analytics success.
Contact us for more information: