CONTACT US
Use Case For Contact Tracing Graph Database

Whether it’s COVID-19 or a future pandemic, contact tracing is a critical feature of slowing and stopping infectious diseases from spreading. For diseases like COVID-19 that spread easily and can be deadly to so many, early, effective, and efficient contact tracing is the primary weapon in the battle against the pandemic. A contact tracing graph database is a helpful tool to store critical data and implement the tracing.
Decisions on who should be contacted first, who should be tested, who should be isolated and quarantined have to be made quickly and accurately, or risk the consequences of an outbreak. The World Health Organization (WHO) has a guidelines that list a set of priorities to determine who should be contacted first.
As a case study, let’s think about what would happen if a single person tested positive at the now somewhat infamous pool party in the Ozarks in Missouri. With more than a hundred people at the party and no social distancing and no one wearing masks, every single person at the party was at risk of being infected. But in this example, who should be contacted first and who should be isolated or quarantined?
As a first step, let’s drill down on two imaginary people at the party, Alice and Bob. Alice is 20 and Bob is 45. Bob who is diabetic and has high blood pressure, has all the risk factors for severe COVID-19 symptoms and hospitalization. Alice is a healthy individual with low risk of being hospitalized. Bob is an essential worker, a long-haul trucker who has limited contact with other people. Alice, on the other hand, is a community organizer who meets with dozens of people on a daily basis in relatively small mask-optional meeting rooms. Bob lives on a farm with his wife and children, as well as his parents and grandparents who are all over the age of 65. Alice lives downtown in a high-rise apartment complex. Which of these two individuals should receive priority and be contacted first to be isolated?

At the level of the individual, Bob is at the greatest personal risk. From a work perspective, Alice has the greatest chance of spreading it to a large group of people and cause an outbreak. Bob’s multi-generational living situation places his parents and grandparents at the greatest risk of hospitalization and death given their age. But, then again, Alice has to share an elevator and a laundry facility. This is truly a multi-dimensional problem with different risk facets and many interconnected issues. To gain a deeper understanding of the risks faced by Alice and Bob, we build their data into graphs.
Harnessing a Contact Tracing Graph Database
Once you start visualizing the data, you can see the unique power of a contact tracing graph database for two main reasons:
- flexibility in the way data are stored; and
- statistics that can be computed on data patterns in the graph itself.
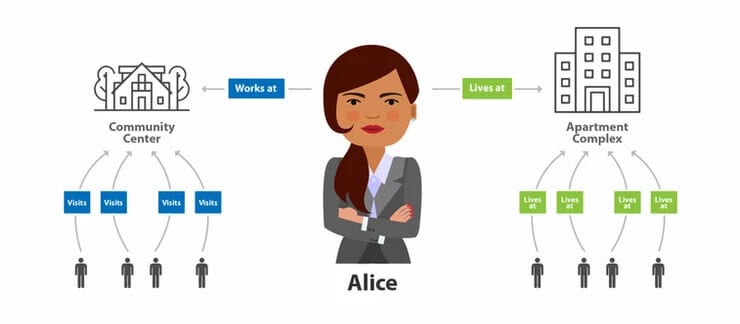
Graphs can be built as entirely schema-less forms of data storage. Sometimes called “property graphs”, the lack of schema means that data can be stored in virtually any shape or form. Graphs store data as nodes and relationships between them, allowing additional information to be stored as properties to be embedded within them. As an example, Alice is an entity, represented as a node with properties such as her age and gender stored within the node. Her workplace building forms another node, with geo-location information and address stored as properties. Alice would then have a “works at” relationship to her workplace node, with her tenure, role, and position stored as properties of the relationship. Co-workers and other members of the organization would form individual nodes attached to Alice’s workplace. These other individuals would have connections to their home addresses and other occupants of those homes.
Within a single query of the contact tracing graph database, we would be able to immediately see all the different individuals connected to Alice through her workplace- her first degree connections. As more connections in the graph are added, 2nd and 3rd degree connections would become available much like a LinkedIn contact network. A key advantage of graphs with multi-degre connections is that they allow “paths” to be traced from one node to the next, and the next, and so on. Path queries give us the ability to follow the trail from Alice, moving from her workplace to her co-workers and their households, while also finding co-workers of the members of those households, all in a single query. Imagine being able to read vertically, horizontally, and diagonally over an entire table in a single pass.
Statistical Deep Dives with Graph Analytics
Once we have built the entire network of people and places, we can leverage the graph to study inbound and outbound edges to detect potential outbreaks and people at the highest risk. Persons with the most inbound connections, the “receiver nodes” are at high risk of getting infected and should receive the highest priority if they have pre-existing conditions. Individuals with a high number of outbound edges or “transmitter nodes” such as Alice are potential “super-spreaders” who should be the first to be quarantined or self-isolated.
Statistical analysis on the distributions of the connections between people and places can also be done to get an idea of the strength of the connections between individuals in the network. Connectivity statistics in a graph give us an opportunity to understand the underlying structure of the network and understand the potential spread. For example, mathematical models of influenza spread show that heavily connected networks where the same group of people tend to congregate around the same locations, disease spread happens earlier in the season. Sparsely connected networks take longer to build and will have infection peaks later on in the season.
Apart from network connectivity and potential spread, graph-based community identification algorithms are available to detect interconnected groups of people. This method can be used to detect upcoming outbreaks of densely connected groups. Or, it can be used to retrospectively detect channels through which a disease spread. By tracking all infected individuals and converting them into networks based on common features, such as work, family, place of worship, and so on, we can then deploy other statistical methods to determine the features that lead to disease spreading. Reverse engineering these features is especially easy in a graph, because all the data you need is already stored and linked to each individual.
Why Not Use Just Machine Learning?
To deploy machine learning algorithms, generally, the correct answer needs to be known, and then the machine is trained to recognize the combinations of data patterns that give rise to the correct answer. Using a contact tracing graph database, we would need to know which individuals were the right and wrong people to contact, and then train the machine to build a model. With this model, new potential contacts would have to be fed through the model to determine risk level. Machine learning is less useful for addressing contact tracing for novel diseases like COVID-19 where there is limited research and data for a model on which it can be trained. From the outset, setting up the data for training and working on feature engineering would cost valuable time. In addition, with research data continuing to be released and to evolve, any machine learning model would have to be continually updated with new data and then retrained, retested, and re-validated. All this comes at the cost of time and confusion to personnel in the face of a fast-moving pandemic where time is of the essence.
Graphs = Flexibility + Efficiency + Insight.
Compared to machine learning alone, a contact tracing graph database is a highly efficient tool during a pandemic. Not only are graphs a flexible method of storing data, they provide an added efficiency by being able to query all the dimensions in the data, while also tracing paths across many degrees of separation in a single run. Beyond the storage flexibility and querying efficiency, we can quickly determine risk levels and who to target in a long list of individuals. Most importantly, the statistics that can be derived from the graph give us real-time insight into the potential risk for outbreaks and retrospective detection of the features of higher disease spread and infections.
Check out additional graph database use cases.
Graphable helps you make sense of your data by delivering expert data analytics consulting, data engineering, custom dev and applied data science services.
We are known for operating ethically, communicating well, and delivering on-time. With hundreds of successful projects across most industries, we have deep expertise in Financial Services, Life Sciences, Security/Intelligence, Transportation/Logistics, HighTech, and many others.
Thriving in the most challenging data integration and data science contexts, Graphable drives your analytics, data engineering, custom dev and applied data science success. Contact us to learn more about how we can help, or book a demo today.
Still learning? Check out a few of our introductory articles to learn more:
- What is a Graph Database?
- What is Neo4j (Graph Database)?
- What Is Domo (Analytics)?
- What is Hume (GraphAware)?
Additional discovery:
- Hume consulting / Hume (GraphAware) Platform
- Neo4j consulting / Graph database
- Domo consulting / Analytics - BI
We would also be happy to learn more about your current project and share how we might be able to help. Schedule a consultation with us today. We can also discuss pricing on these initial calls, including Neo4j pricing and Domo pricing. We look forward to speaking with you!
Graphable helps you make sense of your data by delivering expert analytics, data engineering, custom dev and applied data science services.
We are known for operating ethically, communicating well, and delivering on-time. With hundreds of successful projects across most industries, we have deep expertise in Financial Services, Life Sciences, Security/Intelligence, Transportation/Logistics, HighTech, and many others.
Thriving in the most challenging data integration and data science contexts, Graphable drives your analytics, data engineering, custom dev and applied data science success. Contact us to learn more about how we can help, or book a demo today.
We are known for operating ethically, communicating well, and delivering on-time. With hundreds of successful projects across most industries, we thrive in the most challenging data integration and data science contexts, driving analytics success.
Contact us for more information: