CONTACT US
Level Up Your Data Analysis With a Quality Domo Implementation [Example Video]
Do you want to learn how to level up your data analysis through a quality Domo implementation? If so, read more from our Domopalooza 2022 expert talk with Graphable Senior Consultant Sarah Evans and Willard-Agri Service Director of IP Joshua Russel. You can also learn more about the Domopalooza event at Domo.com.
Domo Implementation Example Presentation Transcript
Sarah: Today, we’ll walk through a Domo implementation example to explore core features that will level up your data analysis. First, we’ll introduce our Willard-Agri Service Director of IP Joshua Russel and hear about their company and data systems.
Next, we’ll talk about their life before Domo, specifically around their reporting. We’ll also take you through our Domo implementation and explain how we used its core features to revolutionize Willard’s reporting capabilities. Lastly, we’ll touch on how Domo has positively changed their business.
About Willard-Agri Service
Joshua: At Willard, our vision is to grow and sustain mutually beneficial partnerships with our employees and customers. We’re always looking for new technologies and farming methods to increase our customers’ yields and profits while minimizing the effect on the environment.
Willard is located around the Chesapeake Bay and in its watershed. For over 50 years, one of our main focus areas has been protecting the bay while producing high-yield agriculture. The Chesapeake Bay watershed covers six states, 150 major rivers and streams. It’s home to over 18 million people.
Over the years, Willard has won two regional and two national environmental Respect Awards. We’ve also been named Retailer of the Year by Agricultural Retailers Association (ARA).
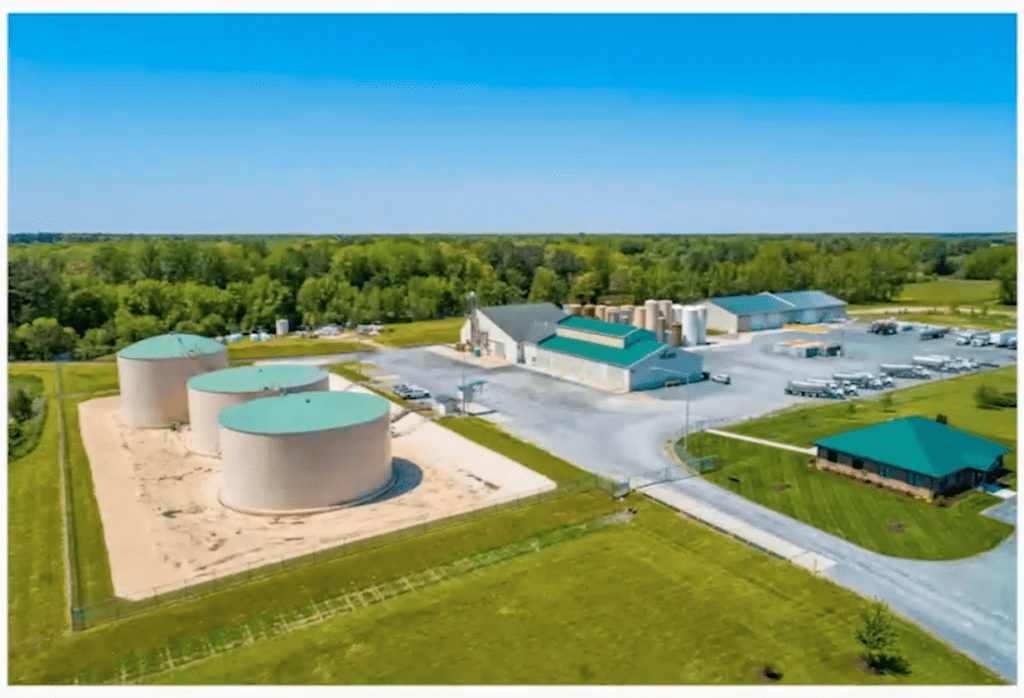
Pictured above is our newest facility in Greenwood, Delaware. We can hold up to three million gallons of plant nutrient inputs. All of our inputs are held within multiple layers of containment to protect against spills.
We produce over 50,000 tons per year of finished product in this location for our farmer customers. As of today, Willard has four facilities in three states. Last year, we merged our original facility from 1970 in Frederick, Maryland with our Mt Airy location, which is about 15 miles down the road. We’ve doubled the capacity at Mt Airy to handle the work for both plants.
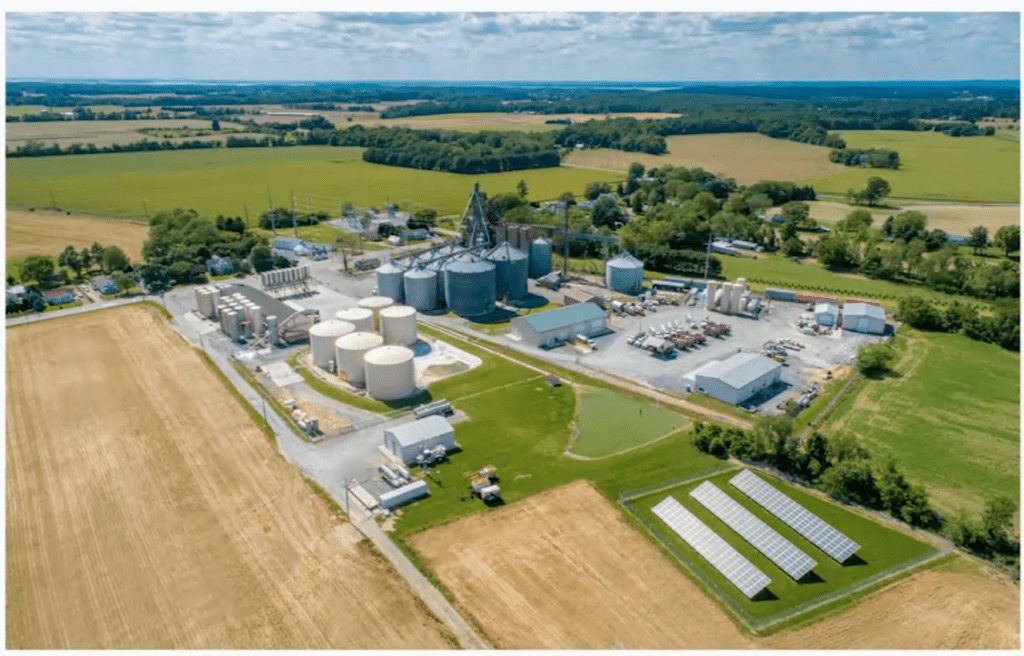
Our Lynch Maryland location is pictured above. We’ve installed a solar panel field, which produces about 90% of the electricity needed to run the facility. Much like Greenwood, Lynch can hold around three million gallons and produce 50,000 tons of finished product.
Willard’s Data Architecture Overview
The Willard data architecture is set up with order entry blend, which is a homegrown AWS cloud-based application built using Python and PostgresQL. It also includes new technologies like Kubernetes that helps us keep our uptime in the 99.9s. This system is designed to flatten our five separate databases into one user-based security platform for all companies to use. It allows us to assign locations and roles for sales, operations and management.
Through our Chrome app, our sales staff can quickly quote a fully customized plant nutrition mix to meet their customers’ yield requirements on a per-field basis. They can then turn these quotes into orders and send them to the plants. Our operations staff can quickly take that order, make the production ticket and push the ticket over to the PLC manufacturing software to produce a load of mixed fertilizer.
Once they finish the actual production, they’re able to push the information over to the AS400 system. The AS400 Mapex is a highly customized on-premise ERP. The system does exactly what we need, but it can also lead to issues with integrating off-the-shelf applications. This basic technology package is about 35 years old. It’s the old green screen, menu-driven workhorse of the 1980s — no pretty GUI interface, but it works.
As for financial reporting, we use Microsoft Dynamics GP. It’s a hybrid cloud-based system. We have a server hosted by a vendor in the cloud, and we use RDP to connect through a VPN. GP receives data from the AS400 in batch format. It holds our inventory financials for all five companies. It does allow us to roll up all the company’s financial reporting, but it’s limited to ad-hoc reporting needs.
Using Domo Implementation to Solve Data Environment Issues
Overall, our current environment does not make it easy to access raw data for reporting. Before our Domo implementation, reporting was very delayed and cumbersome to change. I’ll give you our first big example: We organize sales reporting by customer and by sales rep. Each month between accounting and IP, we would produce 22 different Excel sheets with year-to-date sales and margin information for each customer.
These numbers are only updated once per month. With our month-end date set for the 25th of each month, the amount of time between a sales report can be huge. If you completed your sale on the 27th of May, it would be considered a June sale because it’s past the 25th of May. The salesperson wouldn’t see that sale on their report until around July 5th.
Domo has solved all of those problems for us by having daily updates for all sales data. Combined data for all five companies and three systems just flat out didn’t happen before Domo. If we need to do something, including multiple systems or companies, we had to do everything manually in Excel. Creating repetitive reports manually in Excel each week, month, quarter or year cost multiple employees weeks of their time.
Speed-to-finish information is so important to make better, timely decisions. Domo also helps reduce workloads for the administrative group and makes it easier for end users to slice and dice the data that matters to them most.
Domo Implementation Walkthrough
Sarah: When we began Willards’ Domo implementation, we first focused on recreating the reports they were spending so much time on creating manually each day, month and quarter.
When we started this process, we were able to use these five Domo core features. For their on-premise application AS400, we download Workbench, which allowed us to get the data for two of their systems.
We also installed a separate instance of Workbench on the remote server for their Microsoft Dynamics GP database. Once we got the schema for both databases, we were able to pull in all the tables. Getting this schema was the first part of Willard having more access to data than they had before.
For their other application, their homegrown blend platform, we were able to use the Domo custom pre-built PostgreSQL SSH connector to bring in all the tables we needed. Next, we focused on the transformation. When we first started the process, it was critical to combine data from their five different companies.
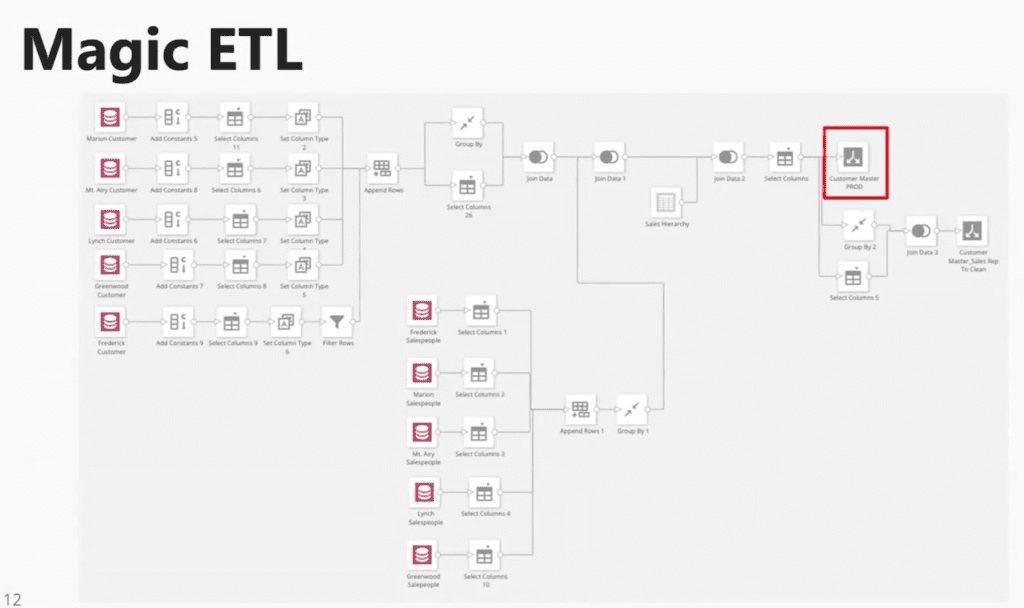
As Josh mentioned, all their data was stored separately for each company, so in almost every ETL we created, they all looked a little like this. (See image above.) We input datasets from each of the five companies, creating any constants or flags that we wanted to add, and then appending them together.
We were also able to incorporate some nuances and more technical aspects of the reporting they wanted to automate, such as handling how historical data or historical sales transition to a new sales rep when they’re assigned.
Creating Up-to-Date Reporting With Domo Implementation
The output highlighted red is a critical first data set we created. Previously, they had to manually update the data each week or month in their customer master data set in Excel. We were able to create an automated, up-to-date file of all their customers from each different company along with their current sales reps, which was always up to date and ready for reporting.
We then were able to join that to other datasets such as inventory, sales, billing and more, and have all the customer information we needed in each dataset. After we transformed the data, we began to build the report.
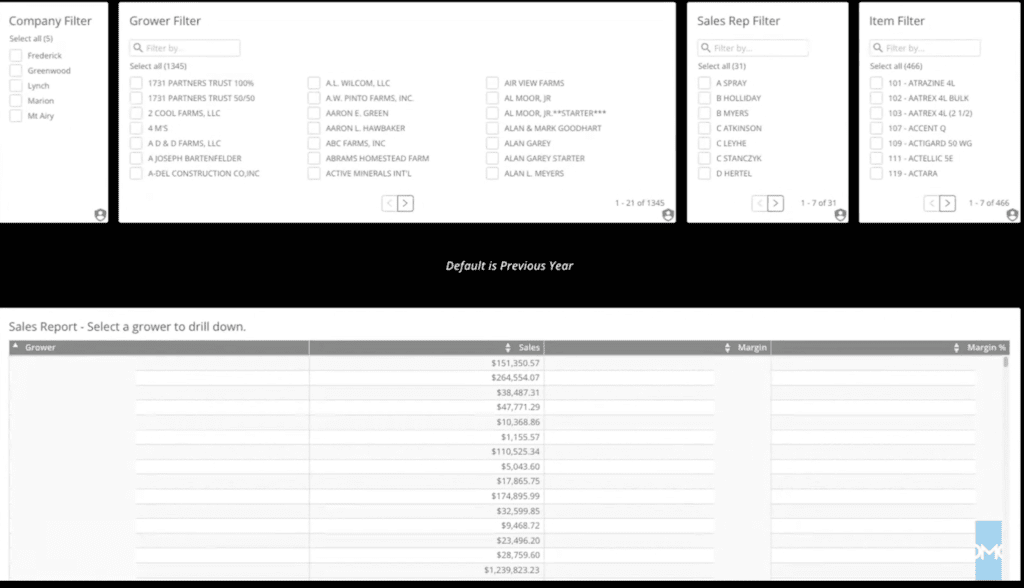
As Domo reports go, this is not the most stylized dashboard, but again, we’re focusing on recreating the reports they spent so much time manually creating each month. In the image above, you can see the sales dashboard we created for their sales reps.
Creating Customized User-Specific Dashboards
First, we used PDP to have one detailed sales data set they were able to share with the entire company. Additionally, the user would only see the information that’s relevant to him or her. We used a Domo webform to have their sales hierarchy from the sales rep all the way up to the owner. They were able to join that into the sales data flow and then set those PDP rules. Again, no matter who’s viewing the dashboard, they’re only seeing information that’s relevant to them.
On the top left, we can see the company filter. As we’ve been emphasizing, that’s a critical component of having both the sales and margin data rolled up for the whole Willard umbrella. We’re also able to filter and slice to one company at a time if needed. The dashboard is readily available to the sales reps, giving them the month-end reporting that the IT and accounting team had to create manually each day.
Not only are they able to see information at the grower level, which is how they previously consumed it, but they were also able to use drill downs to give them a detailed view, which they didn’t have previously.
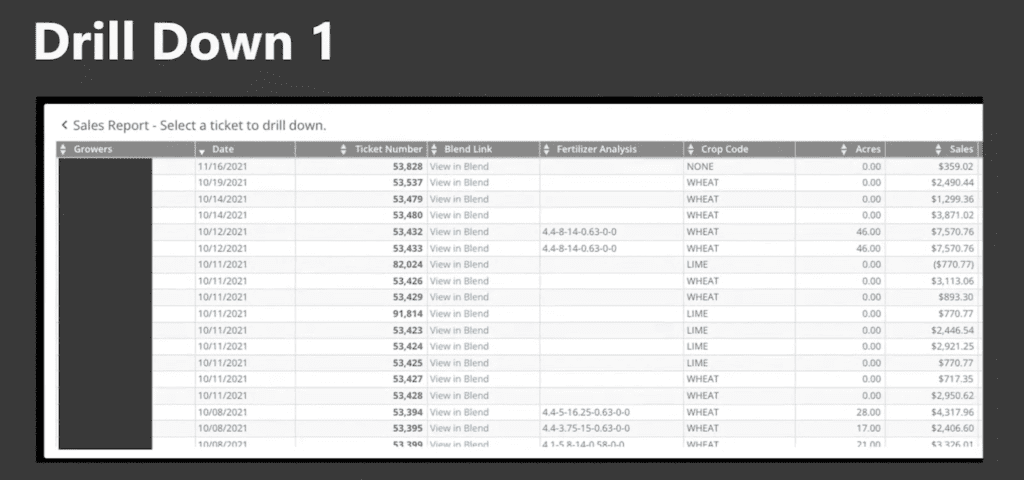
In the dashboard above, if they click a grower, it drills down into this first view. Here, we have ticket-level information per grower. Again, this is something they didn’t have previously. And per ticket, they’re able to see the exact crop, fertilizer makeup, number of sales and their margins on the ticket.
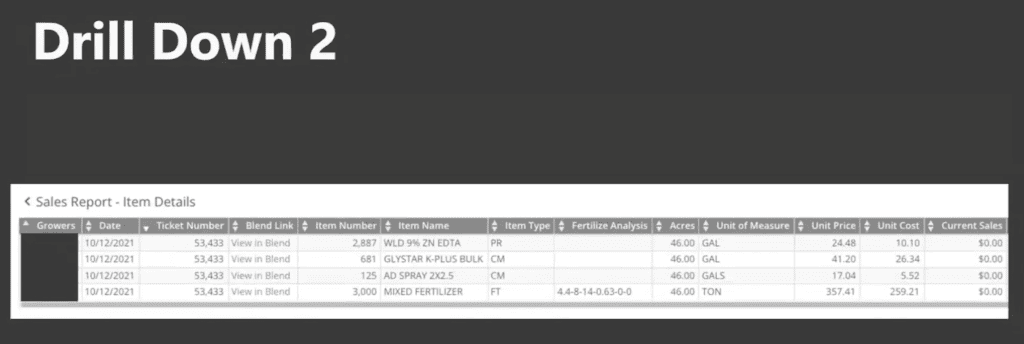
Using Domo to Streamline Reporting and Sales Cycles
From there, we can able take it one step further by providing item-level information. We’re able to click on a specific ticket and drill down to see the exact makeup of that order. Seeing the margins and sales per item gives the sales reps new perspectives, allowing them to further target sales operations. They can check to make sure the information is accurate and edit if needed. And if they click on that link, they can see the exact same ticket in their blend system.
They can even click on the top middle part of the order number. It takes them right to the order the sales rep put in. This allows them to see the exact ticket makeup that was reflected in Domo and have a seamless integration between all systems.
When we first started the Domo implementation, we were focused on alleviating the time and effort the IT and accounting teams were putting into creating Willards’ daily, monthly and quarterly reports. The reports we focused on were not necessarily the most stylized reports, but we were able to give users direct access to the data they needed. Not only that, it gave them more access to data they did not have previously. This allowed teams at all levels, from executives to sales reps, to be on the same page about the information they were looking at to make wise business decisions.
Download our free dashboard backgrounds!
Conclusion
Joshua: We’re just at the beginning of our Domo journey, but it’s already been paying dividends. Our quick access to information and time savings for the end user and back-end employee have been huge. We’re generating many more new ideas that will help our company grow by using the data we’ve collected. The next set of problems we’ll be solving with Domo includes focusing on sales forecasting, pipeline management and providing inventories of raw materials in real-time.
Based on sales forecasting, we’ll be able to predict needs for purchasing beyond past history. Then we’ll be able to set alerts to reorder materials and sales alerts based on customer data points. We also want to look into using the mapping features to help with territory planning.
I know we’re only scratching the surface of Domo today. Maybe we’re using 5% of what it can provide. We really see Domo as a tool that can help us organize our data and produce relevant information for better decision-making based on actual and predictive data.
Sarah: Thank you, Domo for allowing us to present and to everybody for listening today.
If you’re looking for an expert Domo consultant to support your organization through Domo implementation, contact Graphable today.
Need help with editing and configuring your visualizations in Domo? Check out our post on the Domo Analyzer.
Still learning? Check out a few of our introductory articles to learn more:
- What is a Graph Database?
- What is Neo4j (Graph Database)?
- What Is Domo (Analytics)?
- What is Hume (GraphAware)?
Additional discovery:
- Hume consulting / Hume (GraphAware) Platform
- Neo4j consulting / Graph database
- Domo consulting / Analytics - BI
We would also be happy to learn more about your current project and share how we might be able to help. Schedule a consultation with us today. We can also discuss pricing on these initial calls, including Neo4j pricing and Domo pricing. We look forward to speaking with you!


