CONTACT US
Link Prediction With Python: Example Using Protein-Protein Interactions [Video]
In this video, Graphable Lead Data Scientist Sean Robinson takes a look at how to build an end-to-end link prediction pipeline with Python using the Neo4j Graph Data Science (GDS) Library v1.8. We’ll discover novel protein-protein interactions through data from the Stanford Analysis Network Project (SNAP).
Learn more:
- Check out the code
- Read our blogs
- About Graphable
- About Neo4j Graph Data Science
- Link prediction walkthrough: Neo4j graph data science library example
- Explore more protein-protein interaction graphs
Video Transcript: Link Prediction With Python (Protein-Protein Interaction Example)
Today we’re going to be going through a step-by-step demonstration of how to perform link prediction with Python in Neo4j’s Graph Data Science Library. Specifically, we’re going to be looking at a really interesting use case within the biomedical field, which is a protein-to-protein interaction prediction example.
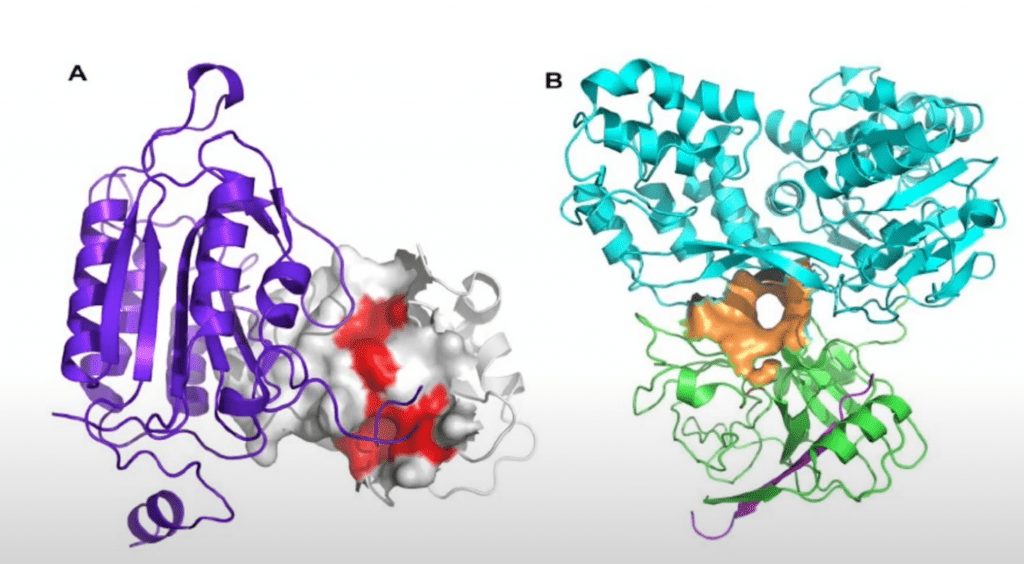
What’s a Protein-Protein Interaction?
What is a protein-to-protein interaction? It’s when one or more proteins come together to form a complex, which you can think of as a small biomechanical machine within your cells that perform some important function. This is incredibly relevant to researchers because if we’re able to look at the history of all of the previously discovered protein interactions and make predictions about potentially undiscovered protein interactions. This can help us find paths toward novel hypothesis generation, which will help us discover treatments for complex diseases.
Stanford Network Analysis Project: Dataset Overview
We’ll be handling a pretty straightforward projection, a simple monopartite graph of protein nodes that interacts with edge to other protein nodes. While we have some self loops here, overall this is pretty straightforward.
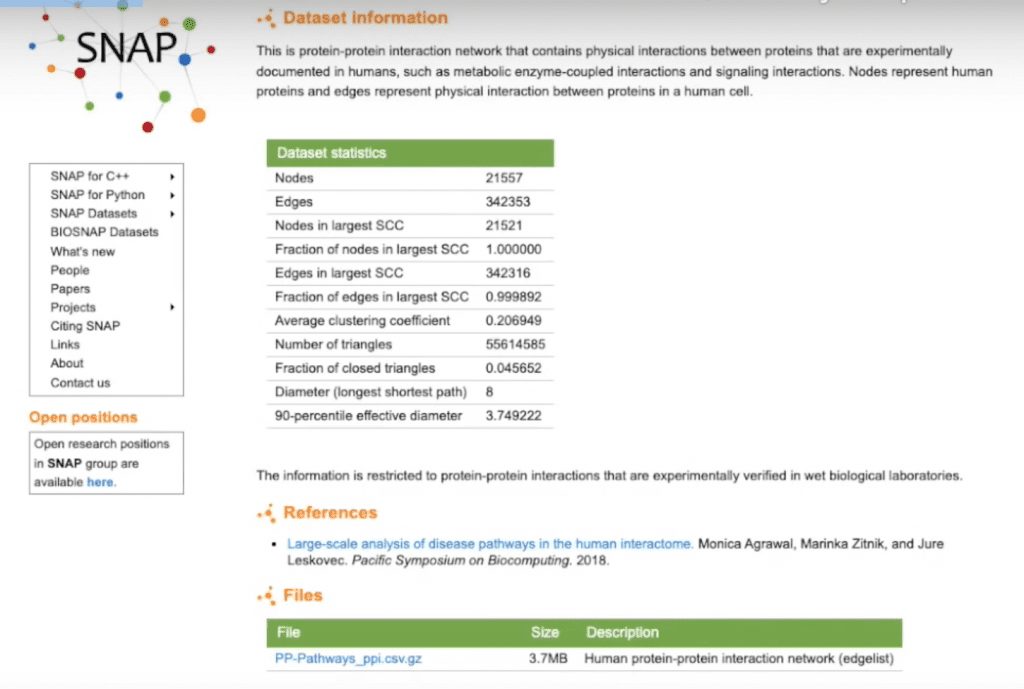
Our data today comes from the Stanford Network Analysis Project (SNAP). We’re going to be using their Human Protein-to-Protein Interaction Network. They’ve already done some work for by providing the summary statistics about the network, so that saves us some analysis up front.
One thing that jumps out at me is that this is about 20,000 nodes and over 300,000 edges, so it’s a moderately sized network. With most of the nodes falling into its largest strongly connected component at a diameter of eight, this appears to be a very dense, interconnected graph, so we’ll keep that in mind during our analysis.

Link Prediction With Python Demo
I’m going to start by importing my relevant libraries, connecting to my local database, and defining a quick helper function to run Cypher and get results back.
Let’s take a look at the dataset, which I’ve uploaded to my GitHub. Again, you can find that in the description, and I encourage you to follow along. One of the things we see is that there isn’t much in the way of node features here. We essentially have a set of node IDs in the form of an edge list, which tell us which proteins are interacting with others but not much else. So we’re going to have to come up with ways to develop our own node features to squeeze some information out of this data.

Link Prediction Data Import
I’m going to import my data by setting up some constraints to ensure the uniqueness of my nodes, creating my nodes and my edges, and we’re ready to start modeling.
The link prediction pipeline I’m going to use is an especially useful mechanism within the Graph Data Science Library that allows me to attach all of my algorithms and models into one cohesive pipeline rather than having to manage them individually and tie them back to one another manually. This is a very convenient function within Neo4j.
Creating Pipeline in Memory
I’m going to create my pipeline in memory, and I’m going to add some fast RP embeddings. And while I don’t have time to get into the specifics of node embeddings here, I’ll add some resources in the description. But all you need to know for now is that a node embedding is a way of creating a vector representation of each node within my network. In this case, I’m going to define those vectors to be of length 256. I’m going to add this fast RP embedding into my pipeline.
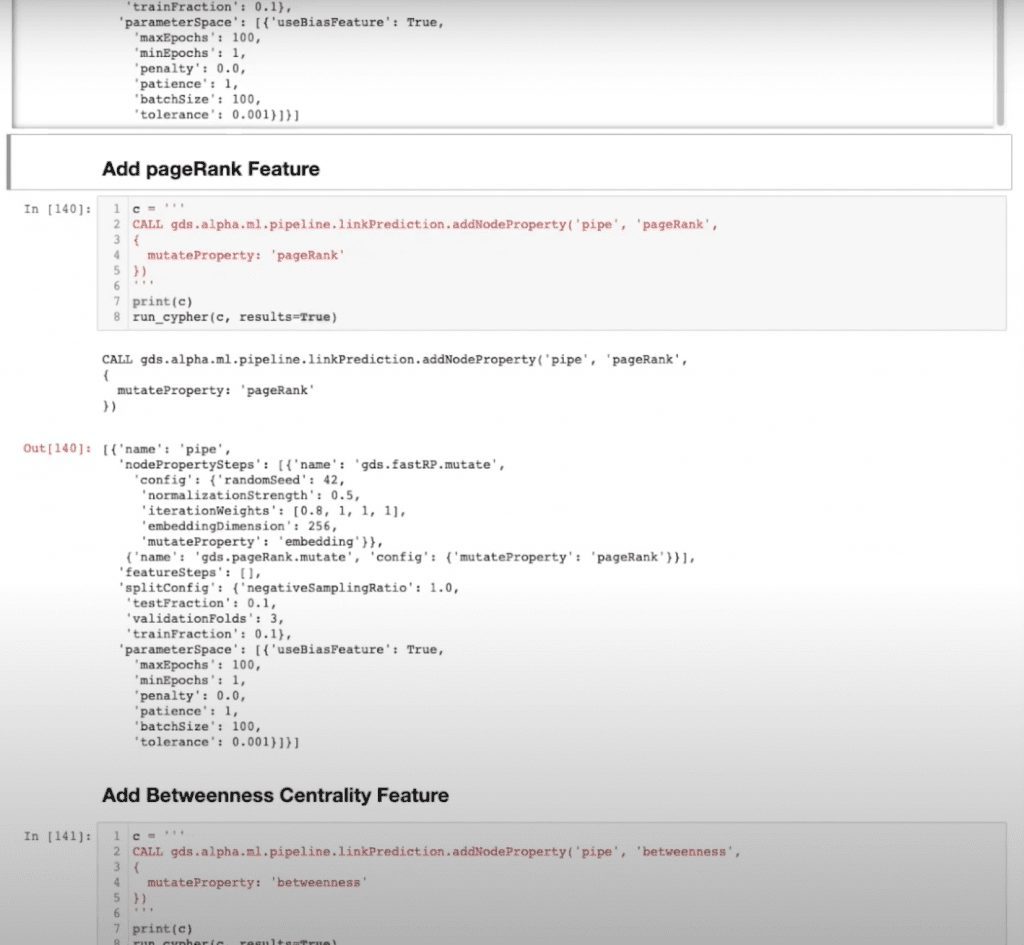
Centrality Measures
I’m also going to add some centrality measures, specifically PageRank and Betweenness, to add some additional enrichment to my features to help capture those high influence and bridge nodes within my network.
I’m going to split my edges in my graph between train and test and configure a set of model parameters that my pipeline will iterate through to find the optimal combination.
Loading Data Into Graph Projection
Lastly, I’m going to load my data into a graph projection within memory. So I’m taking the data that currently exists in my database and projecting it into memory that all my models and algorithms can run on. In this case, I’m calling my protein nodes and my interacts with edges, and I’m going to use an undirected orientation. Now we’re ready to train our model.
Training Results
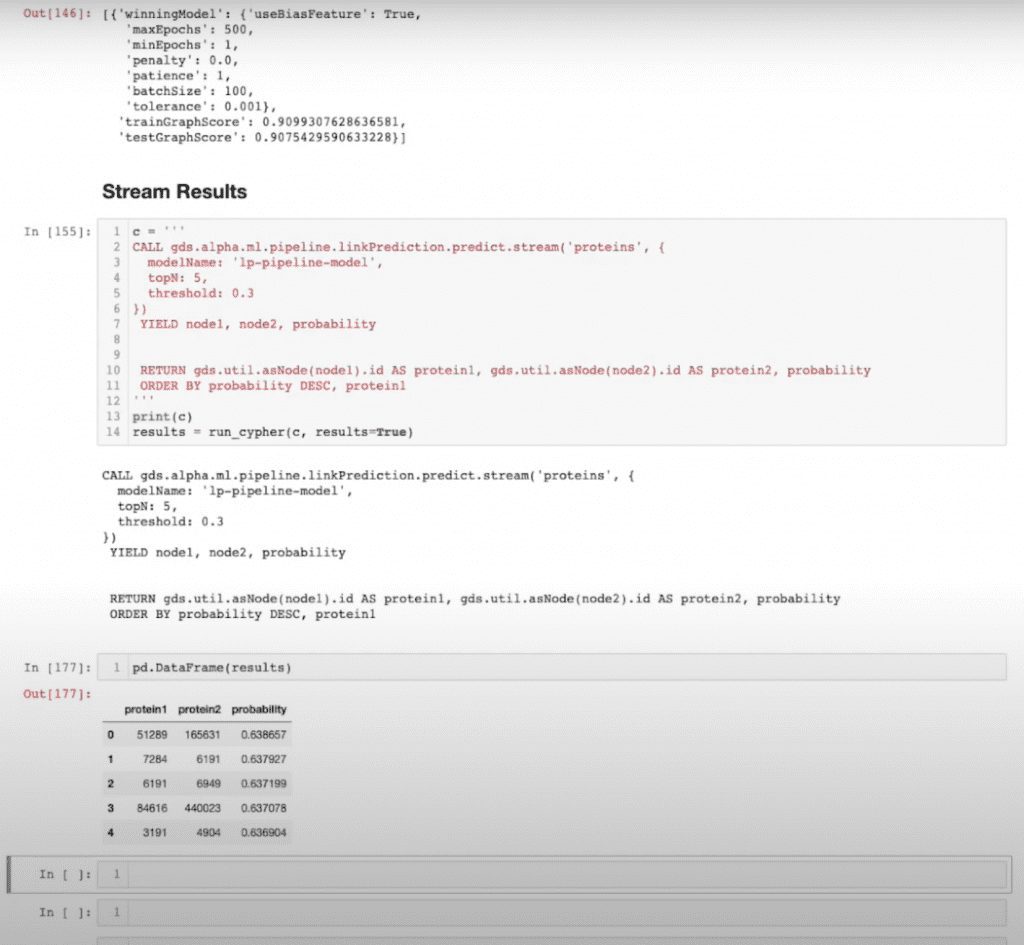
We’ll take a look at our training results. I can see I have a training graph score and a test graph score of 90. It’s important to note that the link prediction model uses the area under the precision recall curve to measure its models. This is important to keep in mind because the area under the precision recall curve, or AUPRC, has an idea of a baseline attached to it, which is equal to the number of positive examples over the number of total examples in a dataset.
In our case, that’s the number of edges present versus the number of possible edges present, which in this case I’ve calculated to come out to a little over 0.1%. Contrasting that with a score of 90, that’s quite performant. If I had calculated that to be something more like 70% of possible edges and I had a score of 90, that wouldn’t be quite as good. But considering what we do have, I feel confident with these results and I’m ready to move forward.
Let’s stream some of our results and take a look at what we’ve got. I’m going to check out my top five predictions.
I can see that most of my probabilities are landing right around this 0.63 range, which is okay because we noticed up front that this is a highly interconnected graph, so it makes sense that our top results would probably be somewhere around the same ranges.
But this is good because now I know that I have a performant model, which gives me the results I want, and that model is now stored within the Neo4j Model Catalog to be able to call it whenever need be. So if I have some downstream tasks, like a hypothesis generation framework for my scientists, I can, with a simple Cypher query, call this endpoint and get some predictions about which proteins they might want to investigate.
I hope this has been a helpful first look at link prediction in the Graph Data Science Library. Again, I encourage you to download the notebook and data in the description and take it for a spin yourself. Try out different algorithms; try out different models or parameters, and see what results you get. I’d be really interested to see what you find.
Graphable helps you make sense of your data by delivering expert data analytics consulting, data engineering, custom dev and applied data science services.
We are known for operating ethically, communicating well, and delivering on-time. With hundreds of successful projects across most industries, we have deep expertise in Financial Services, Life Sciences, Security/Intelligence, Transportation/Logistics, HighTech, and many others.
Thriving in the most challenging data integration and data science contexts, Graphable drives your analytics, data engineering, custom dev and applied data science success. Contact us to learn more about how we can help, or book a demo today.
Still learning? Check out a few of our introductory articles to learn more:
- What is a Graph Database?
- What is Neo4j (Graph Database)?
- What Is Domo (Analytics)?
- What is Hume (GraphAware)?
Additional discovery:
- Hume consulting / Hume (GraphAware) Platform
- Neo4j consulting / Graph database
- Domo consulting / Analytics - BI
We would also be happy to learn more about your current project and share how we might be able to help. Schedule a consultation with us today. We can also discuss pricing on these initial calls, including Neo4j pricing and Domo pricing. We look forward to speaking with you!
Graphable helps you make sense of your data by delivering expert analytics, data engineering, custom dev and applied data science services.
We are known for operating ethically, communicating well, and delivering on-time. With hundreds of successful projects across most industries, we have deep expertise in Financial Services, Life Sciences, Security/Intelligence, Transportation/Logistics, HighTech, and many others.
Thriving in the most challenging data integration and data science contexts, Graphable drives your analytics, data engineering, custom dev and applied data science success. Contact us to learn more about how we can help, or book a demo today.
We are known for operating ethically, communicating well, and delivering on-time. With hundreds of successful projects across most industries, we thrive in the most challenging data integration and data science contexts, driving analytics success.
Contact us for more information: