CONTACT US
Graph Database Geospatial Analysis: Increase Data Value with Geospatial Analytics

In this graph database geospatial overview article we’ll explore more deeply what a graph is, and explore the valuable intersection between maps and graphs as well as how geospatial analytics can surface insights in uniquely valuable ways.
What is Graph Database Geospatial Analytics?
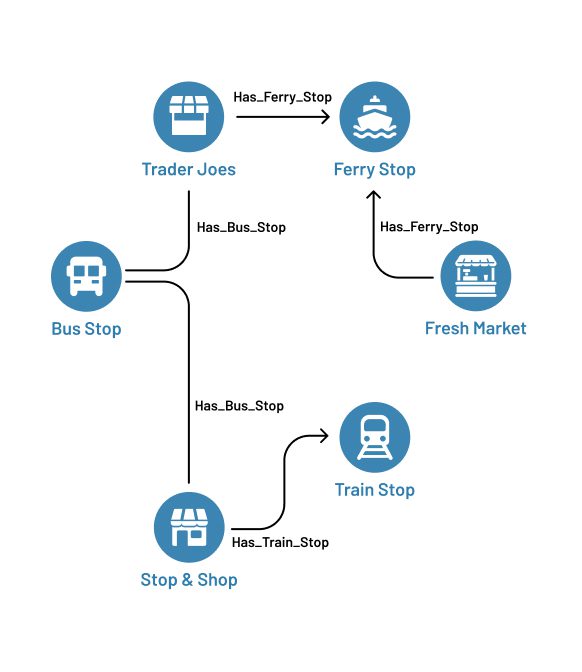
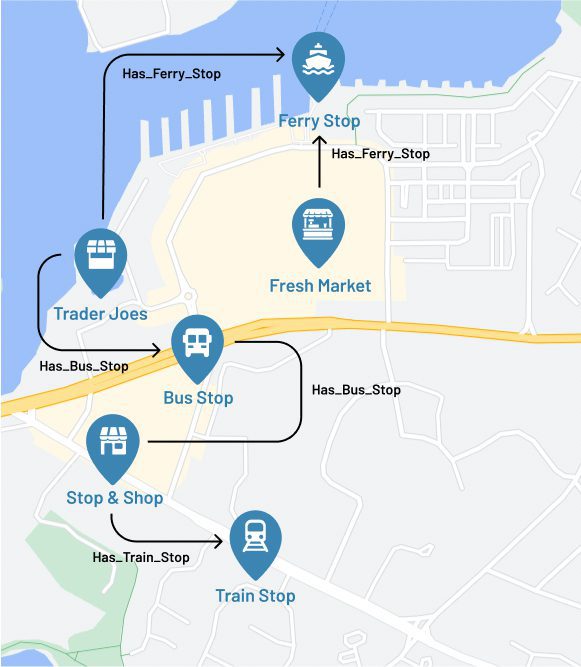
When working with a graph database, beginning with the query flowing all the way through the overlay of geospatial data on a map is logical and straightforward. With simple cypher queries, we are able to visualize the data exactly how it is stored in a graph database, as nodes and relationships.
Even the graph database itself is in fact a kind of map- a map depicting how data points or nodes are related. As we display this geospatial data on our map, we can increase the analytical insights by adding layers to them. These map overlays add additional context and value to the geospatial data, improving our geospatial analytics.
Combining graph data with maps significantly increases the value of both sets of data as they are now in context with each other. Graph databases efficiently store the intrinsically interconnected information as connected data, while maps visually display that data in its most understandable form for many use cases.
How Maps Bring Value
Maps are very obviously an integral part of our everyday life. Whether it be outlining a project workflow, or mappng the utility connections running through your town, to finding your friends on social media, interconnected data and maps of things exist everywhere. These unbiquitous examples can be displayed in a data table or some other visualization but are often better understood by displaying it in a map of some kind.
Maps are familiar and easy to digest. Beyond familiarity, maps reveal connections more efficiently. They have a natural tendency to illustrate existing connections between objects that are not always immediately evident.
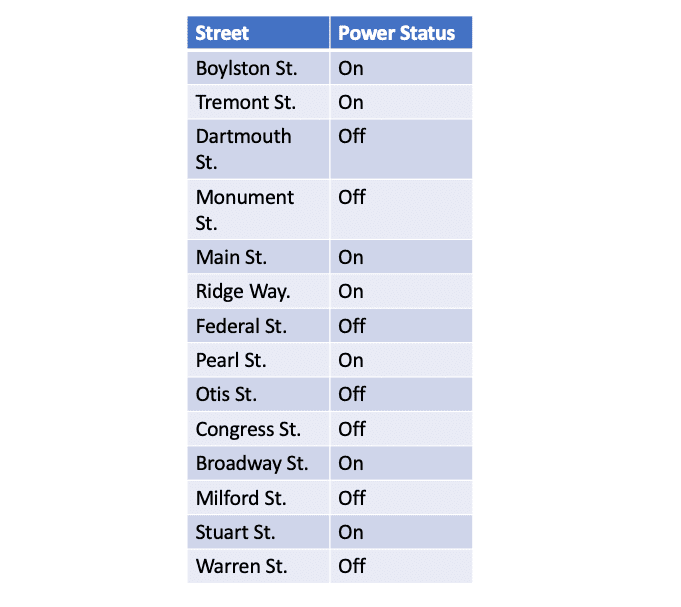
Maps also capitalize on how the human brain naturally retains information – by connecting concepts together via the relationships between them. For example, if you lived on Warren St. in the below power outage map example, you might wonder how soon you could have your power restored.
Without already knowing how the streets connect and which streets have power, it’s difficult to estimate from the date table when Warren St. will have power back. By displaying the information in a very simple geospatial map of streets and substations (in this case without any layers), the viewer can quickly digest more information and can better guess when power might be restored.

Graph database geospatial analysis gives extra context and meaning to the data. With a graph database, such as Neo4j, and geocoded data to leverage Neo4j geospatial capabilites, we can use features such as the Neo4j Spatial library to enable spatial operations on data.
Geosptatial Data Modeling
By querying a graph database and displaying our results with a Neo4j map visualization we can better understand how the streets connect and power lines intersect as shown in the above example. But what does it take to be able to structure the data inside a graph database to enable this geospatial analysis?
In general, data modeling is the process of visually documenting and depicting the flow and connections between various data structures and data points. Graph data modeling is no different. In the case of graph databases, and unlike many of their counterparts, the visual depiction of the data model is precisely the same as the structure in the graph database. Elements are presented as nodes or entities, and the connections between the elements are shown in relationships or edges.
This means that geospatial data modelling in graph databases is far simpler, as there are no unique structures or storage options to consider for this use case. Unlike other databases, everything is always stored as a node or an edge, all stored the same way as any other data in a graph database, with additional attributes available on each object to embed contextual data for each item (e.g. lat/long).
Referring back to the neighborhood power example above, maps and geospatial analysis naturally give context and meaning to all the valuable individual data points that are less helpful simply on their own. This additional context gives far more valuable insights, more quickly.
Uncover Previously Hidden Connections in Maps
In the increasingly interconnected world in which we live, maps have unique power to display data and reveal connections not easily detected without them. For example, prior to the advent of online mapping capabilities, detectives and law enforcement would oftent pin pictures on a board and connect the pins with string, in effect creating for themselves a map of their investigation.
They would take the evidence they have, that on the surface seems scattered, making the connections that they have discovered, and use that to unveil other patterns and connections they might not have been able to see otherwise.
They would map their data in this way to better understand how members in one set might be connected to members in another set. For example, a map like this enabled them to not just read the addresses of stores with shoplifting issues, but to visualize the locations and how they might relate. This visual association of addresses often drives insights not yet captured in the data, such as groupings or the regionality of the shoplifiting problems, and even potential next targets.
While not specifically geospatial in nature, fraud detection is another example that highlights the benefits of leveraging graph databases in maps of a diffrent kind. Historically, fraud prevention has focused on suspicious individuals, accounts, and/or IP addresses. However, with the sophisticated technology fraudsters are implementing more and more, by mapping fraud data in a visual map it then becomes more possible to uncover difficult-to-see patterns as they seek to evade capture with new technologies.
To show how this can work, in a typical online transaction now, there is often embedded in the connected data a set of relationships and a path from the IP address, geo-location, tracking cookie to the credit card number and so on. Some gray area is common with shared accounts and families, but as soon as the relation between these variables exceeds a reasonable threshold identified by analysts, it can be flagged for review as possible fraud activity.
In other words, using graphs and maps to store and display transaction data helps reveal relationships and patterns that are often hard to identify, where fraud could be considered as a strong possibility. In future articles we’ll dive into utilizing the Neo4j spatial library to search data within specific regions or distances from a point of interest, as we could in this fraud detection example.

The Unique Value of Graph Databases in Geosptatial Analytics
Maps and online geosptial analysis have been around for decades. However, with the advent and success of graph databases, the value of map-based analysis has increased. While we will cover more in future articles on the value and use cases for graph database geospatial analysis, below are a list of some of the more obvious points:
- Graphs are faster than traditional RDBMS at the kind of multi-hop, connected data queries required for maps and geospatial queries
- The uniquely connected nature of graph viziualizations, combined with the visual context of maps make the combination unusally valuable
- Graphs are uniquely equipped to capture the multidimensionality of geographic data and related interactions
- Given Google’s position on graphs/network science being the future of data science, graph data science becomes even more valuable and powerful as the geosptial is stored, queried and displayed using graph databases and graph geospatial applications.
- Combining graph models of geospatial data with other geospatial services can result in valuable analysis being returned back to the graph for persisted graph enrichment
Conclusion
Graph database geospatial analysis offers unique opportunities to drive even more value than online mapping has in the past. On their own, maps are relatable, contextual, and can often reveal information difficult to find any other way. Moving from offline to online capabilities made geospatial analytics even more valuable.
When we add in the unique value of graph databases in powering geospatial analysis, along with the analysis and graph data science advantages of graph databases, this combination can now deliver on the full potential of geospatial for our organizations. When overlaying a Neo4j geospatial map or utilizing the Neo4j spatial library with a graph database, your analysis becomes even that much more valuable.
For examples of geospatial analysis in traditional analytics, see how to create and utilize a map-based application as well as how to create Domo maps. For a more advanced discussion, check out our article on the Uber H3 grid system, and to take it even further read our graph data science article on graph traversal algorithms. Also, read the following to better understand where your organization may be in the analytics maturity model stages.
Graphable helps you make sense of your data by delivering expert data analytics consulting, data engineering, custom dev and applied data science services.
We are known for operating ethically, communicating well, and delivering on-time. With hundreds of successful projects across most industries, we have deep expertise in Financial Services, Life Sciences, Security/Intelligence, Transportation/Logistics, HighTech, and many others.
Thriving in the most challenging data integration and data science contexts, Graphable drives your analytics, data engineering, custom dev and applied data science success. Contact us to learn more about how we can help, or book a demo today.
Still learning? Check out a few of our introductory articles to learn more:
- What is a Graph Database?
- What is Neo4j (Graph Database)?
- What Is Domo (Analytics)?
- What is Hume (GraphAware)?
Additional discovery:
- Hume consulting / Hume (GraphAware) Platform
- Neo4j consulting / Graph database
- Domo consulting / Analytics - BI
We would also be happy to learn more about your current project and share how we might be able to help. Schedule a consultation with us today. We can also discuss pricing on these initial calls, including Neo4j pricing and Domo pricing. We look forward to speaking with you!
Graphable helps you make sense of your data by delivering expert analytics, data engineering, custom dev and applied data science services.
We are known for operating ethically, communicating well, and delivering on-time. With hundreds of successful projects across most industries, we have deep expertise in Financial Services, Life Sciences, Security/Intelligence, Transportation/Logistics, HighTech, and many others.
Thriving in the most challenging data integration and data science contexts, Graphable drives your analytics, data engineering, custom dev and applied data science success. Contact us to learn more about how we can help, or book a demo today.
We are known for operating ethically, communicating well, and delivering on-time. With hundreds of successful projects across most industries, we thrive in the most challenging data integration and data science contexts, driving analytics success.
Contact us for more information: