CONTACT US
Using Survey Graphs to Gain Customer Insights: Customer Survey Database Example

The COVID-19 pandemic accelerated the migration of consumers away from brick-and-mortar locations and to online commerce. With the volume online transactions trending up significantly, understanding customer feedback is more difficult, but more important than ever.
Feedback from customers on their experience and satisfaction is critical for customer retention and long-term growth, which is even more important without face-to-face interactions and the loyalty that it can engender. Businesses now have to rely on customers completing surveys, often even before, during, and after the transaction, to gauge their level of satisfaction and to discern some level of in-context feedback.
Despite significant effort, most companies find it challenging to gain any meaningful insight from their customer surveys. Data often sits in multiple tables with complex relationships that never end up being used or analyzed. Simply put, storing customer survey database examples and results in a table makes it difficult to digest, so the data often sits unused. The complexity of contextualizing the relationships between data points, especially from product/service to sentiment, hinders the extraction of critical information, no matter how much effort went it collecting it in the first place.
In this article, we present a novel approach of storing survey database examples and results in a survey graph database (e.g. ,Neo4j) to overcome this barrier and extract meaningful insight from the survey data.
Customer Survey Database Example and Connected Data
Too often, our clients think of survey data as disembodied from point-of-sale and product information. But in fact, a survey is an amalgamation of many different influences on the customer experience, culminating in a survey response.
Each piece of information is based on the context of the customer experience, quality of product or service, the buying process, and the many other dimensions related to the customer interaction. Simply understanding that a customer had negative or positive comments does little to help identify and fix the bad or to identify and promote the good.

Curious about Graph Databases?
You might be wondering, what is a graph database? A property graph model in a graph database such as Neo4j organizes data by nodes and relationships. With nodes as the entities of the graph, they hold a number of properties and labels. Relationships, or edges, provide connections between two node entities. Unlike a relational database, the structure of a graph database flexes and evolves along with your business and industry.
In a graph database, one can quickly explore neighboring data around a set of initial starting points, handling the structured and even unstructured data, all at performance levels that are magnitudes greater than relational databases- especially when operating at scale. When traditional queries come to a grinding halt as the number and depth of relationships increase, graph database performance can stay constant even as your business and data grows.
Benefits of a Survey Graph Database
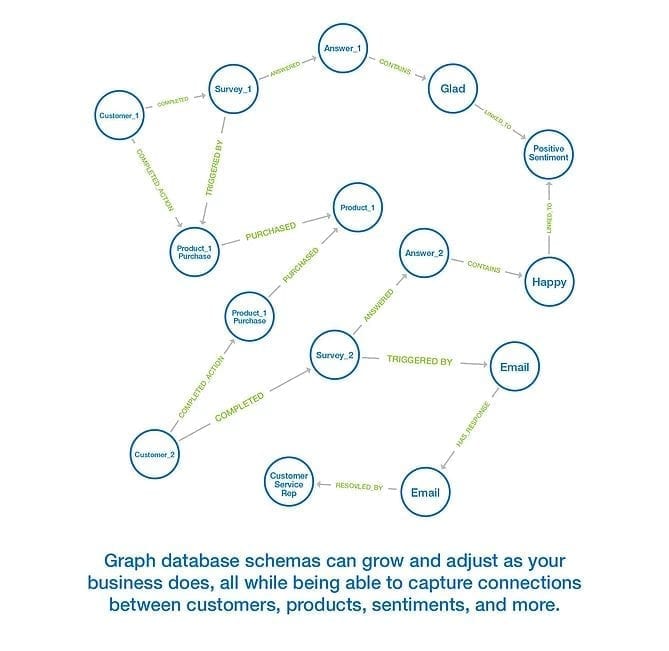
Graph databases offer a flexible schema structure and design while powering the graph, allowing organizations to extend, shrink and modify their data models as the business evolves, and even develop survey graphs.
As a survey database example: Companies often begin with a simple survey after a customer has completed a purchase. As a company obtains responses with information on what aspects of the buying process the customer favored and any pain points they experienced, they often expand the survey, asking more specific questions, even at times adding a survey right during the buying process.
With a survey graph database as a digital twin of the surveys, as surveys expand and evolve, one can adjust the corresponding graph model without having to completely overhaul the database, as required with relational databases. Survey graph databases allow for changes to the data model with little or no impact to the application.
Performant
As businesses grow, so do their number of transactions and volume of data, including the customer response surveys which aggregate over time. Collecting and storing this customer feedback is important, but storing the data in a relational tables effectively locks that feedback away.
In a traditional relational database, highly connected queries often time out as the number and depth of relationships increase, or they require massive investments in additional hardware to support the connected use cases. Graph databases are specifically designed to facilitate understanding when it comes to highly connected data and use cases that center on the connectedness within that data.
Survey Data Model Example
One survey data model example is the deeply connected nature of a customer buying experience such as: the customer themselves, the products the customer bought or saved in their cart and didn’t buy, all surveys the customer completed, all surveys the customer did not complete, etc. Because graph databases were invented for just such use cases and data, they can remain performant even as companies’ data continually grows in size and complexity.
Directional and Sequential
A unique feature of a graph database is that they enable data to be directionally weighted, such that A–>B can be weighted differently from B–>A, which is uniquely valuable in use cases focusing on paths/connectedness. More importantly, graphs can form chains to trace paths or sequences of events.
Take a survey data model example: The sequence of words in a response can greatly affect the meaning. If a customer says “The process was simply wonderful”, that would have a different meaning than a customer saying “The process was wonderfully simple.” The “schemaless” nature of the graph enables even words and phrases to be linked to products and interactions with customers and staff, and to be stored and queried from a single graph database.
From survey responses, the survey graph is uniquely capable of surfacing connected keywords and sentiments relating to specific paths within those customer experiences over time. As an example, using a graph database, organizations could easily evidence sentiment related to a complex set of connections where customers bought product X and interacted with staff member Y through email after having previously bought 2 other products for which 3 other people gave positive reviews.
Free Text Handling
Multiple choice questions on surveys are important; they prompt the customer with answer choices, reducing the effort for them to complete the survey, increasing survey response rates and making analysis simpler. However, when organizations do include free text comments in surveys it has the potential to provide deep and valuable insight, but often it isn’t utilized because it can be so difficult to work within relational contexts.
As a result, organizations can miss valuable feedback in the form of commentary, and it can obscure the customer’s actual sentiment. Text response options enable the customer to provide their thoughts more freely regarding any aspect of their experience, often giving important context to the more structured responses- but it is only valuable if companies can use it.
Graphable clients can often think that complex Natural Language Processing or NLP is required to gain insight from free-text survey responses, but that does not have to be the case when using graph databases. Working on NLP/U can be an expensive undertaking if one deploys large models that demand a lot of computing capacity and data science expertise.
Moreover, if the verbiage used by your customer is highly contextual, clients need a team to read and tag free text responses to create training data for machine learning models that then enables them to interpret the freeform text.
For an example of how context can impact NLP, if a response mentioned “dolphin”, you may know by your experience that the text is referring to the mammal; however, NLP will almost always associate “dolphin” with “fish” due to the Mahi-mahi fish being commonly called “dolphin fish”. While NLP is the best solution from a technical standpoint, not every organization has the need or will to spend the time, money, and effort to develop a production-ready NLP capability.
A lighter, leaner, and more cost-effective alternative is to extract words using a standardized vocabulary and match those words to sentiments, all more easily developed with proprietary or open-source dictionaries. With these data loaded into the same graph as the survey data, more precise contextualization is now possible.
In the graph, one can link words and sentiments to customers, products, and track every contact point throughout the customer journey. This approach will not solve every problem or answer every question, but leveraging a graph database, and using simpler techniques like these can often drive significant value at much lower cost overall.
Instead of understanding survey results through manual labor and/or by storing the data in inefficient and brittle relational data stores, a graph-based approach to survey interpretation becomes a surgical tool that can equip decision-makers with clear, insightful customer feedback, as it is unfolding, flexibly changing as the business evolves its interactions with customers.
Understanding the customer empowers confident decision-making while keeping both business health and customer satisfaction in mind- especially important in this era of increasing digital transactions and decreasing in-person interaction.
Check out additional Neo4j use cases including a contract tracing graph database, exploring bike data using Uber H3 Grid System, and graph databases in pro sports, graph database fraud detection, and analytics with ChatGPT (also about What is ChatGPT? and the ChatGPT topic in general).
Graphable helps you make sense of your data by delivering expert data analytics consulting, data engineering, custom dev and applied data science services.
We are known for operating ethically, communicating well, and delivering on-time. With hundreds of successful projects across most industries, we have deep expertise in Financial Services, Life Sciences, Security/Intelligence, Transportation/Logistics, HighTech, and many others.
Thriving in the most challenging data integration and data science contexts, Graphable drives your analytics, data engineering, custom dev and applied data science success. Contact us to learn more about how we can help, or book a demo today.
Still learning? Check out a few of our introductory articles to learn more:
- What is a Graph Database?
- What is Neo4j (Graph Database)?
- What Is Domo (Analytics)?
- What is Hume (GraphAware)?
Additional discovery:
- Hume consulting / Hume (GraphAware) Platform
- Neo4j consulting / Graph database
- Domo consulting / Analytics - BI
We would also be happy to learn more about your current project and share how we might be able to help. Schedule a consultation with us today. We can also discuss pricing on these initial calls, including Neo4j pricing and Domo pricing. We look forward to speaking with you!
Graphable helps you make sense of your data by delivering expert analytics, data engineering, custom dev and applied data science services.
We are known for operating ethically, communicating well, and delivering on-time. With hundreds of successful projects across most industries, we have deep expertise in Financial Services, Life Sciences, Security/Intelligence, Transportation/Logistics, HighTech, and many others.
Thriving in the most challenging data integration and data science contexts, Graphable drives your analytics, data engineering, custom dev and applied data science success. Contact us to learn more about how we can help, or book a demo today.
We are known for operating ethically, communicating well, and delivering on-time. With hundreds of successful projects across most industries, we thrive in the most challenging data integration and data science contexts, driving analytics success.
Contact us for more information: